History Matters: Path dependence and innovation in British city ...
History Matters: Path dependence and innovation in British city ...
History Matters: Path dependence and innovation in British city ...

You also want an ePaper? Increase the reach of your titles
YUMPU automatically turns print PDFs into web optimized ePapers that Google loves.
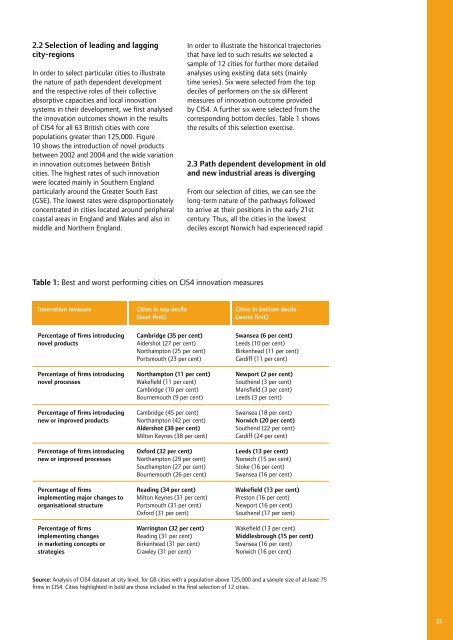
2.2 Selection of lead<strong>in</strong>g <strong>and</strong> lagg<strong>in</strong>g<br />
<strong>city</strong>-regions<br />
In order to select particular cities to illustrate<br />
the nature of path dependent development<br />
<strong>and</strong> the respective roles of their collective<br />
absorptive capacities <strong>and</strong> local <strong><strong>in</strong>novation</strong><br />
systems <strong>in</strong> their development, we first analysed<br />
the <strong><strong>in</strong>novation</strong> outcomes shown <strong>in</strong> the results<br />
of CIS4 for all 63 <strong>British</strong> cities with core<br />
populations greater than 125,000. Figure<br />
10 shows the <strong>in</strong>troduction of novel products<br />
between 2002 <strong>and</strong> 2004 <strong>and</strong> the wide variation<br />
<strong>in</strong> <strong><strong>in</strong>novation</strong> outcomes between <strong>British</strong><br />
cities. The highest rates of such <strong><strong>in</strong>novation</strong><br />
were located ma<strong>in</strong>ly <strong>in</strong> Southern Engl<strong>and</strong><br />
particularly around the Greater South East<br />
(GSE). The lowest rates were disproportionately<br />
concentrated <strong>in</strong> cities located around peripheral<br />
coastal areas <strong>in</strong> Engl<strong>and</strong> <strong>and</strong> Wales <strong>and</strong> also <strong>in</strong><br />
middle <strong>and</strong> Northern Engl<strong>and</strong>.<br />
In order to illustrate the historical trajectories<br />
that have led to such results we selected a<br />
sample of 12 cities for further more detailed<br />
analyses us<strong>in</strong>g exist<strong>in</strong>g data sets (ma<strong>in</strong>ly<br />
time series). Six were selected from the top<br />
deciles of performers on the six different<br />
measures of <strong><strong>in</strong>novation</strong> outcome provided<br />
by CIS4. A further six were selected from the<br />
correspond<strong>in</strong>g bottom deciles. Table 1 shows<br />
the results of this selection exercise.<br />
2.3 <strong>Path</strong> dependent development <strong>in</strong> old<br />
<strong>and</strong> new <strong>in</strong>dustrial areas is diverg<strong>in</strong>g<br />
From our selection of cities, we can see the<br />
long-term nature of the pathways followed<br />
to arrive at their positions <strong>in</strong> the early 21st<br />
century. Thus, all the cities <strong>in</strong> the lowest<br />
deciles except Norwich had experienced rapid<br />
Table 1: Best <strong>and</strong> worst perform<strong>in</strong>g cities on CIS4 <strong><strong>in</strong>novation</strong> measures<br />
Innovation measure<br />
Cities <strong>in</strong> top decile<br />
(best first)<br />
Cities <strong>in</strong> bottom decile<br />
(worst first)<br />
Percentage of firms <strong>in</strong>troduc<strong>in</strong>g<br />
novel products<br />
Percentage of firms <strong>in</strong>troduc<strong>in</strong>g<br />
novel processes<br />
Percentage of firms <strong>in</strong>troduc<strong>in</strong>g<br />
new or improved products<br />
Percentage of firms <strong>in</strong>troduc<strong>in</strong>g<br />
new or improved processes<br />
Percentage of firms<br />
implement<strong>in</strong>g major changes to<br />
organisational structure<br />
Percentage of firms<br />
implement<strong>in</strong>g changes<br />
<strong>in</strong> market<strong>in</strong>g concepts or<br />
strategies<br />
Cambridge (35 per cent)<br />
Aldershot (27 per cent)<br />
Northampton (25 per cent)<br />
Portsmouth (23 per cent)<br />
Northampton (11 per cent)<br />
Wakefield (11 per cent)<br />
Cambridge (10 per cent)<br />
Bournemouth (9 per cent)<br />
Cambridge (45 per cent)<br />
Northampton (42 per cent)<br />
Aldershot (38 per cent)<br />
Milton Keynes (38 per cent)<br />
Oxford (32 per cent)<br />
Northampton (29 per cent)<br />
Southampton (27 per cent)<br />
Bournemouth (26 per cent)<br />
Read<strong>in</strong>g (34 per cent)<br />
Milton Keynes (31 per cent)<br />
Portsmouth (31 per cent)<br />
Oxford (31 per cent)<br />
Warr<strong>in</strong>gton (32 per cent)<br />
Read<strong>in</strong>g (31 per cent)<br />
Birkenhead (31 per cent)<br />
Crawley (31 per cent)<br />
Swansea (6 per cent)<br />
Leeds (10 per cent)<br />
Birkenhead (11 per cent)<br />
Cardiff (11 per cent)<br />
Newport (2 per cent)<br />
Southend (3 per cent)<br />
Mansfield (3 per cent)<br />
Leeds (3 per cent)<br />
Swansea (18 per cent)<br />
Norwich (20 per cent)<br />
Southend (22 per cent)<br />
Cardiff (24 per cent)<br />
Leeds (13 per cent)<br />
Norwich (15 per cent)<br />
Stoke (16 per cent)<br />
Swansea (16 per cent)<br />
Wakefield (13 per cent)<br />
Preston (16 per cent)<br />
Newport (16 per cent)<br />
Southend (17 per cent)<br />
Wakefield (13 per cent)<br />
Middlesbrough (15 per cent)<br />
Swansea (16 per cent)<br />
Norwich (16 per cent)<br />
Source: Analysis of CIS4 dataset at <strong>city</strong> level, for GB cities with a population above 125,000 <strong>and</strong> a sample size of at least 75<br />
firms <strong>in</strong> CIS4. Cities highlighted <strong>in</strong> bold are those <strong>in</strong>cluded <strong>in</strong> the f<strong>in</strong>al selection of 12 cities.<br />
23