

ANNUAL REPORT 2006 - Skanska
ANNUAL REPORT 2006 - Skanska
ANNUAL REPORT 2006 - Skanska

You also want an ePaper? Increase the reach of your titles
YUMPU automatically turns print PDFs into web optimized ePapers that Google loves.
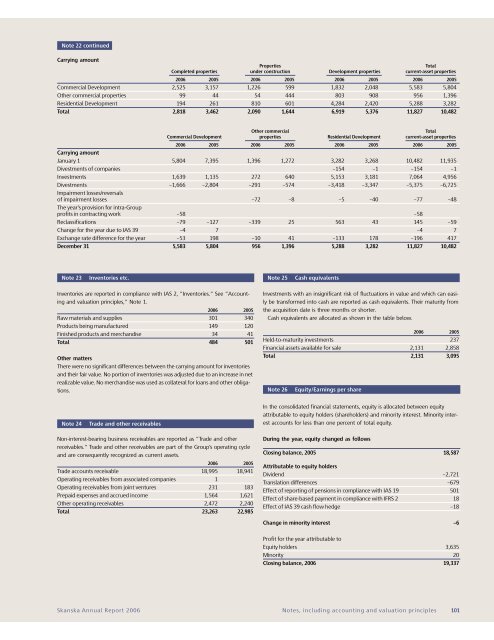
Note 22 continued<br />
Carrying amount<br />
Properties<br />
Total<br />
Completed properties under construction Development properties current-asset properties<br />
<strong>2006</strong> 2005 <strong>2006</strong> 2005 <strong>2006</strong> 2005 <strong>2006</strong> 2005<br />
Commercial Development 2,525 3,157 1,226 599 1,832 2,048 5,583 5,804<br />
Other commercial properties 99 44 54 444 803 908 956 1,396<br />
Residential Development 194 261 810 601 4,284 2,420 5,288 3,282<br />
Total 2,818 3,462 2,090 1,644 6,919 5,376 11,827 10,482<br />
Other commercial<br />
Total<br />
Commercial Development properties Residential Development current-asset properties<br />
<strong>2006</strong> 2005 <strong>2006</strong> 2005 <strong>2006</strong> 2005 <strong>2006</strong> 2005<br />
Carrying amount<br />
January 1 5,804 7,395 1,396 1,272 3,282 3,268 10,482 11,935<br />
Divestments of companies –154 –1 –154 –1<br />
Investments 1,639 1,135 272 640 5,153 3,181 7,064 4,956<br />
Divestments –1,666 –2,804 –291 –574 –3,418 –3,347 –5,375 –6,725<br />
Impairment losses/reversals<br />
of impairment losses –72 –8 –5 –40 –77 –48<br />
The year’s provision for intra-Group<br />
profits in contracting work –58 –58<br />
Reclassifications –79 –127 –339 25 563 43 145 –59<br />
Change for the year due to IAS 39 –4 7 –4 7<br />
Exchange rate difference for the year –53 198 –10 41 –133 178 –196 417<br />
December 31 5,583 5,804 956 1,396 5,288 3,282 11,827 10,482<br />
Note 23<br />
Inventories etc.<br />
Note 25<br />
Cash equivalents<br />
Inventories are reported in compliance with IAS 2, ”Inventories.” See ”Accounting<br />
and valuation principles,” Note 1.<br />
<strong>2006</strong> 2005<br />
Raw materials and supplies 301 340<br />
Products being manufactured 149 120<br />
Finished products and merchandise 34 41<br />
Total 484 501<br />
Investments with an insignificant risk of fluctuations in value and which can easily<br />
be transformed into cash are reported as cash equivalents. Their maturity from<br />
the acquisition date is three months or shorter.<br />
Cash equivalents are allocated as shown in the table below.<br />
<strong>2006</strong> 2005<br />
Held-to-maturity investments 237<br />
Financial assets available for sale 2,131 2,858<br />
Total 2,131 3,095<br />
Other matters<br />
There were no significant differences between the carrying amount for inventories<br />
and their fair value. No portion of inventories was adjusted due to an increase in net<br />
realizable value. No merchandise was used as collateral for loans and other obligations.<br />
Note 26 Equity/Earnings per share<br />
Note 24<br />
Trade and other receivables<br />
In the consolidated financial statements, equity is allocated between equity<br />
attributable to equity holders (shareholders) and minority interest. Minority interest<br />
accounts for less than one percent of total equity.<br />
Non-interest-bearing business receivables are reported as ”Trade and other<br />
receivables.” Trade and other receivables are part of the Group’s operating cycle<br />
and are consequently recognized as current assets.<br />
<strong>2006</strong> 2005<br />
Trade accounts receivable 18,995 18,941<br />
Operating receivables from associated companies 1<br />
Operating receivables from joint ventures 231 183<br />
Prepaid expenses and accrued income 1,564 1,621<br />
Other operating receivables 2,472 2,240<br />
Total 23,263 22,985<br />
During the year, equity changed as follows<br />
Closing balance, 2005 18,587<br />
Attributable to equity holders<br />
Dividend –2,721<br />
Translation differences –679<br />
Effect of reporting of pensions in compliance with IAS 19 501<br />
Effect of share-based payment in compliance with IFRS 2 18<br />
Effect of IAS 39 cash flow hedge –18<br />
Change in minority interest –6<br />
Profit for the year attributable to<br />
Equity holders 3,635<br />
Minority 20<br />
Closing balance, <strong>2006</strong> 19,337<br />
<strong>Skanska</strong> Annual Report <strong>2006</strong> Notes, including accounting and valuation principles 101


