Note 43 continued Balance sheets In compliance with IFRS In compliance with SWGAAP Dec 31 <strong>2006</strong> Dec 31 2005 Jan 1 1 2005 Dec 31 2004 Jan 1 1 2004 Dec 31 2003 Dec 31 2002 ASSETS Non-current assets Property, plant and equipment 5,457 5,243 4,978 5,507 6,700 6,730 7,808 Goodwill 4,490 4,154 3,899 3,899 4,259 4,259 5,360 Intangible assets 740 644 535 535 542 459 481 Investments in joint ventures and associated companies 1,894 1,834 862 862 1,374 1,374 1,468 Financial non-current assets 2,4 1,500 1,236 1,253 1,137 2,032 2,032 1,408 Deferred tax assets 1,976 2,282 1,620 1,633 1,459 1,539 1,621 Total non-current assets 16,057 15,393 13,147 13,573 16,366 16,393 18,146 Current assets Current-asset properties 3 11,827 10,482 11,935 11,948 13,866 13,694 19,544 Inventories 484 501 483 610 828 828 865 Financial current assets 4 3,154 2,260 2,771 2,490 1,248 1,248 1,128 Tax assets 330 330 269 269 415 415 310 Gross amount due from customers for contract work 5,222 5,610 3,653 3,579 4,768 4,814 4,896 Trade and other receivables 23,263 22,985 21,579 21,744 22,309 22,309 26,096 Cash equivalents 2,131 3,095 3,053 3,053 218 218 303 Cash 8,839 10,583 5,794 5,815 6,819 6,819 5,460 Assets classified as held for sale 72 869 Total current assets 55,250 55,918 50,406 49,508 50,471 50,345 58,602 TOTAL ASSETS 71,307 71,311 63,553 63,081 66,837 66,738 76,748 of which interest-bearing 15,441 16,975 12,421 12,421 10,241 10,241 7,749 EQUITY Equity attributable to equity holders 19,190 18,454 16,240 16,251 14,501 14,169 14,217 Minority interest 147 133 117 117 200 200 298 Total equity 19,337 18,587 16,357 16,368 14,701 14,369 14,515 LIABILITIES Non-current liabilities Financial non-current liabilities 4 2,039 2,424 3,300 3,046 5,714 7,182 13,845 Pensions 1,556 2,407 1,108 1,112 1,771 2,058 984 Deferred tax liabilities 2,892 2,831 2,708 2,744 3,164 3,104 2,317 Non-current provisions 119 143 135 135 174 175 16 Total non-current liabilities 6,606 7,805 7,251 7,037 10,823 12,519 17,162 Current liabilities Financial current liabilities 4 1,396 1,080 1,197 1,006 2,277 808 2,607 Tax liabilities 728 595 994 998 571 571 447 Current provisions 3,476 3,200 2,735 2,740 3,050 3,055 3,062 Gross amount due to customers for contract work 11,357 11,782 10,471 10,428 9,311 9,311 10,174 Trade and other payables 28,407 28,220 24,224 24,504 26,104 26,105 28,781 Liabilities classified as held for sale 42 324 Total current liabilities 45,364 44,919 39,945 39,676 41,313 39,850 45,071 TOTAL EQUITY AND LIABILITIES 71,307 71,311 63,553 63,081 66,837 66,738 76,748 of which interest-bearing 5,064 5,864 5,192 5,192 9,804 10,091 17,125 1 In addition to the balance sheets on December 31 of each year, the tables present the opening balance in compliance with IFRS on January 1, 2004 as well as the transition to IAS 39 and IFRS 5 on January 1, 2005. 2 of which shares 59 59 74 74 76 76 547 3 Current-asset properties Commercial Development 5,583 5,804 7,395 7,408 9,421 9,249 12 610 Other commercial properties 956 1,396 1,272 1,272 1,051 1,051 2,120 Residential Development 5,288 3,282 3,268 3,268 3,394 3,394 4,814 11,827 10,482 11,935 11,948 13,866 13,694 19,544 4 Items related to non-interest-bearing unrealized changes in value of derivatives/securities are included in the following amounts: Financial non-current assets 8 107 116 Financial current assets 116 35 281 Financial non-current liabilities 6 22 254 Financial current liabilities 60 196 193 122 Notes, including accounting and valuation principles <strong>Skanska</strong> Annual Report <strong>2006</strong>
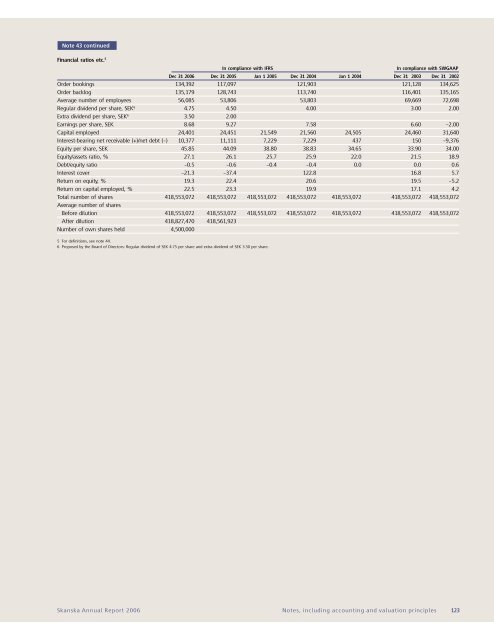
Financial ratios etc. 5 In compliance with IFRS In compliance with SWGAAP Note 43 continued Dec 31 <strong>2006</strong> Dec 31 2005 Jan 1 2005 Dec 31 2004 Jan 1 2004 Dec 31 2003 Dec 31 2002 Order bookings 134,392 117,097 121,903 121,128 134,625 Order backlog 135,179 128,743 113,740 116,401 135,165 Average number of employees 56,085 53,806 53,803 69,669 72,698 Regular dividend per share, SEK 6 4.75 4.50 4.00 3.00 2.00 Extra dividend per share, SEK 6 3.50 2.00 Earnings per share, SEK 8.68 9.27 7.58 6.60 –2.00 Capital employed 24,401 24,451 21,549 21,560 24,505 24,460 31,640 Interest-bearing net receivable (+)/net debt (–) 10,377 11,111 7,229 7,229 437 150 –9,376 Equity per share, SEK 45.85 44.09 38.80 38.83 34.65 33.90 34.00 Equity/assets ratio, % 27.1 26.1 25.7 25.9 22.0 21.5 18.9 Debt/equity ratio –0.5 –0.6 –0.4 –0.4 0.0 0.0 0.6 Interest cover –21.3 –37.4 122.8 16.8 5.7 Return on equity, % 19.3 22.4 20.6 19.5 –5.2 Return on capital employed, % 22.5 23.3 19.9 17.1 4.2 Total number of shares 418,553,072 418,553,072 418,553,072 418,553,072 418,553,072 418,553,072 418,553,072 Average number of shares Before dilution 418,553,072 418,553,072 418,553,072 418,553,072 418,553,072 418,553,072 418,553,072 After dilution 418,827,470 418,561,923 Number of own shares held 4,500,000 5 For definitions, see note 44. 6 Proposed by the Board of Directors: Regular dividend of SEK 4.75 per share and extra dividend of SEK 3.50 per share. <strong>Skanska</strong> Annual Report <strong>2006</strong> Notes, including accounting and valuation principles 123
- Page 1 and 2:
ANNUAL REPORT 2006
- Page 3 and 4:
Business streams and organization C
- Page 5 and 6:
During 2007 we closed and began con
- Page 7 and 8:
Skanska’s core businesses Skanska
- Page 9 and 10:
Ambitious financial and qualitative
- Page 11 and 12:
0—15 MUSD, 25% • 15—30 MUSD,
- Page 13 and 14:
expertise can be kept in projects.
- Page 15 and 16:
largest group, with about 60 millio
- Page 17 and 18:
To the left: At Norra Bantorget in
- Page 19 and 20:
To the left: The Palace of Justice
- Page 21 and 22:
CONSTRUCTION MORE THAN 200 STORES U
- Page 23 and 24:
During 2006 Skanska USA Civil furth
- Page 25 and 26:
CONSTRUCTION NEW SUCCESSES IN THE G
- Page 27 and 28:
To the left: In Kärra, 10 km (6 mi
- Page 29 and 30:
To the left: Today the former Films
- Page 31 and 32:
RESIDENTIAL DEVELOPMENT LIVING CLOS
- Page 33 and 34:
yggande, förvaltning och försälj
- Page 35 and 36:
Skanska is developing Norra Bantorg
- Page 37 and 38:
The Danish unit of Svenska Handelsb
- Page 39 and 40:
COMMERCIAL DEVELOPMENT THE INNER HA
- Page 41 and 42:
To the left: The first phase of Der
- Page 43 and 44:
Market risk concession, example Ava
- Page 45 and 46:
0 6,7% 7,7% 8,7% 9,7% 10,7% 11,7% 1
- Page 47 and 48:
INFRASTRUCTURE DEVELOPMENT FIRST WI
- Page 49 and 50:
% Number 100 80 60 40 20 0 Environm
- Page 51 and 52:
Awards and achievements During 2006
- Page 53 and 54:
Zero tolerance to corruption At the
- Page 55 and 56:
Report of the Directors The Board o
- Page 57 and 58:
tive effect of about SEK 90 M due t
- Page 59 and 60:
SEK M 2006 2005 Strategic investmen
- Page 61 and 62:
Slovakian company. The fine in Skan
- Page 63 and 64:
The dilution effect during 2006 is
- Page 65 and 66:
Consolidated balance sheet SEK M No
- Page 67 and 68:
Consolidated cash flow statement SE
- Page 69 and 70:
Parent Company balance sheet SEK M
- Page 71 and 72:
Notes including accounting and valu
- Page 73 and 74: income,” “Financial expenses”
- Page 75 and 76: Internal profits Internal profits t
- Page 77 and 78: it nor taxable profit. Also not tak
- Page 79 and 80: IAS 39, “Financial Instruments: R
- Page 81 and 82: Note 3 Effects of changes in accoun
- Page 83 and 84: Note 4 continued Central, eliminati
- Page 85 and 86: Note 4 continued C. Other informati
- Page 87 and 88: Note 6 continued Liquidity reserve
- Page 89 and 90: Note 7 Business combinations Busine
- Page 91 and 92: Note 10 Operating income Operating
- Page 93 and 94: Note 13 Impairment losses/Reversals
- Page 95 and 96: Note 16 continued Deferred tax asse
- Page 97 and 98: Note 18 Goodwill Goodwill is recogn
- Page 99 and 100: Note 20 Investments in joint ventur
- Page 101 and 102: Note 20 continued Note 21 Financial
- Page 103 and 104: Note 22 continued Carrying amount P
- Page 105 and 106: Note 26 continued Equity attributab
- Page 107 and 108: Note 28 continued Pension obligatio
- Page 109 and 110: Note 31 Specification of interest-b
- Page 111 and 112: Note 33 Assets pledged Assets pledg
- Page 113 and 114: Note 34 continued Effect on the Gro
- Page 115 and 116: Note 35 Cash flow statement Aside f
- Page 117 and 118: Note 36 Personnel Wages, salaries,
- Page 119 and 120: Note 37 continued C. Benefits to th
- Page 121 and 122: Note 40 Leases Skanska is a lessee
- Page 123: Note 43 Five-year Group financial s
- Page 127 and 128: Parent Company notes Note 45 Financ
- Page 129 and 130: Note 52 Holdings in Group companies
- Page 131 and 132: Note 59 Expected recovery periods o
- Page 133 and 134: Proposed allocation of earnings The
- Page 135 and 136: Corporate governance report of Skan
- Page 137 and 138: Attendance at Board and Committee m
- Page 139 and 140: Senior Executive Team Johan Karlstr
- Page 141 and 142: Curt Källströmer Head of Chairman
- Page 143 and 144: More information Worldwide The Skan
- Page 145 and 146: Abbreviations BOT Build Own/Operate
- Page 147: Addresses Skanska AB SE-169 83 Soln