

ANNUAL REPORT 2006 - Skanska
ANNUAL REPORT 2006 - Skanska
ANNUAL REPORT 2006 - Skanska

Create successful ePaper yourself
Turn your PDF publications into a flip-book with our unique Google optimized e-Paper software.
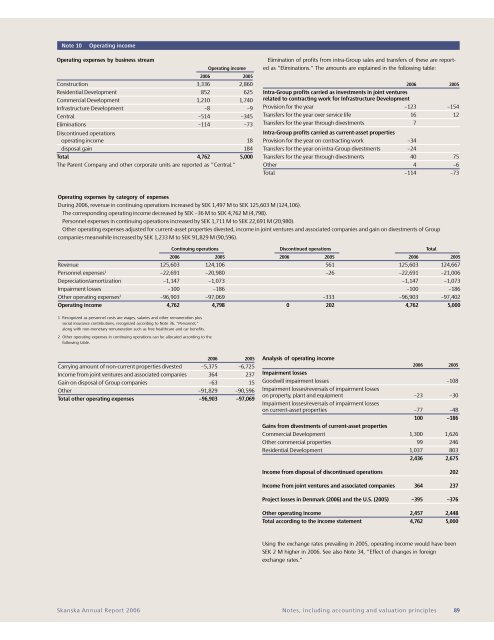
Note 10<br />
Operating income<br />
Operating expenses by business stream<br />
Operating income<br />
<strong>2006</strong> 2005<br />
Construction 3,336 2,860<br />
Residential Development 852 625<br />
Commercial Development 1,210 1,740<br />
Infrastructure Development –8 –9<br />
Central –514 –345<br />
Eliminations –114 –73<br />
Discontinued operations<br />
operating income 18<br />
disposal gain 184<br />
Total 4,762 5,000<br />
The Parent Company and other corporate units are reported as ”Central.”<br />
Elimination of profits from intra-Group sales and transfers of these are reported<br />
as ”Eliminations.” The amounts are explained in the following table:<br />
<strong>2006</strong> 2005<br />
Intra-Group profits carried as investments in joint ventures<br />
related to contracting work for Infrastructure Development<br />
Provision for the year –123 –154<br />
Transfers for the year over service life 16 12<br />
Transfers for the year through divestments 7<br />
Intra-Group profits carried as current-asset properties<br />
Provision for the year on contracting work –34<br />
Transfers for the year on intra-Group divestments –24<br />
Transfers for the year through divestments 40 75<br />
Other 4 –6<br />
Total –114 –73<br />
Operating expenses by category of expenses<br />
During <strong>2006</strong>, revenue in continuing operations increased by SEK 1,497 M to SEK 125,603 M (124,106).<br />
The corresponding operating income decreased by SEK –36 M to SEK 4,762 M (4,798).<br />
Personnel expenses in continuing operations increased by SEK 1,711 M to SEK 22,691 M (20,980).<br />
Other operating expenses adjusted for current-asset properties divested, income in joint ventures and associated companies and gain on divestments of Group<br />
companies meanwhile increased by SEK 1,233 M to SEK 91,829 M (90,596).<br />
Continuing operations Discontinued operations Total<br />
<strong>2006</strong> 2005 <strong>2006</strong> 2005 <strong>2006</strong> 2005<br />
Revenue 125,603 124,106 561 125,603 124,667<br />
Personnel expenses 1 –22,691 –20,980 –26 –22,691 –21,006<br />
Depreciation/amortization –1,147 –1,073 –1,147 –1,073<br />
Impairment losses –100 –186 –100 –186<br />
Other operating expenses 2 –96,903 –97,069 –333 –96,903 –97,402<br />
Operating income 4,762 4,798 0 202 4,762 5,000<br />
1 Recognized as personnel costs are wages, salaries and other remuneration plus<br />
social insurance contributions, recognized according to Note 36, ”Personnel,”<br />
along with non-monetary remuneration such as free healthcare and car benefits.<br />
2 Other operating expenses in continuing operations can be allocated according to the<br />
following table.<br />
<strong>2006</strong> 2005<br />
Carrying amount of non-current properties divested –5,375 –6,725<br />
Income from joint ventures and associated companies 364 237<br />
Gain on disposal of Group companies –63 15<br />
Other –91,829 –90,596<br />
Total other operating expenses –96,903 –97,069<br />
Analysis of operating income<br />
<strong>2006</strong> 2005<br />
Impairment losses<br />
Goodwill impairment losses –108<br />
Impairment losses/reversals of impairment losses<br />
on property, plant and equipment –23 –30<br />
Impairment losses/reversals of impairment losses<br />
on current-asset properties –77 –48<br />
100 –186<br />
Gains from divestments of current-asset properties<br />
Commercial Development 1,300 1,626<br />
Other commercial properties 99 246<br />
Residential Development 1,037 803<br />
2,436 2,675<br />
Income from disposal of discontinued operations 202<br />
Income from joint ventures and associated companies 364 237<br />
Project losses in Denmark (<strong>2006</strong>) and the U.S. (2005) –395 –376<br />
Other operating income 2,457 2,448<br />
Total according to the income statement 4,762 5,000<br />
Using the exchange rates prevailing in 2005, operating income would have been<br />
SEK 2 M higher in <strong>2006</strong>. See also Note 34, ”Effect of changes in foreign<br />
exchange rates.”<br />
<strong>Skanska</strong> Annual Report <strong>2006</strong> Notes, including accounting and valuation principles 89


