200 - Typhoon Committee
200 - Typhoon Committee
200 - Typhoon Committee

Create successful ePaper yourself
Turn your PDF publications into a flip-book with our unique Google optimized e-Paper software.
TCAR<br />
CHAPTER 1 - TYPHOON COMMITTEE ACTIVITIES <strong>200</strong>7<br />
<strong>200</strong>7<br />
e. Research Progress<br />
Seasonal Prediction of the Tropical Cyclone Activity over<br />
the Western North Pacific and the Korean Peninsula<br />
Tropical cyclone is the most destructive natural<br />
phenomenon in the world. To predict this destructive<br />
tropical cyclone there have been many prediction<br />
studies using a statistical model or a dynamical model.<br />
A statistical model has been developed for the purpose<br />
of predicting the seasonal activity of tropical cyclones<br />
over the Western North Pacific (WNP) and the Korean<br />
peninsula. The predictors are the number of tropical<br />
cyclones (TC), tropical cyclones that exceed typhoon<br />
strength (TY) and the overall TC activity index which is<br />
referred to as Normalized <strong>Typhoon</strong> Activity (NTA) index<br />
during summer period (June to August), fall period<br />
(September to November), and over the whole year<br />
(May to December).<br />
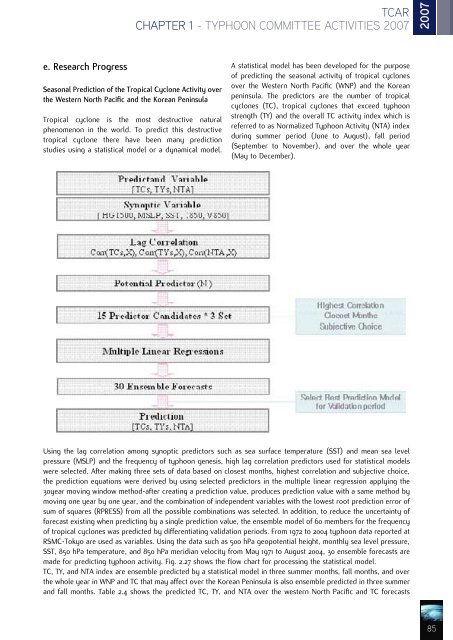
Using the lag correlation among synoptic predictors such as sea surface temperature (SST) and mean sea level<br />
pressure (MSLP) and the frequency of typhoon genesis, high lag correlation predictors used for statistical models<br />
were selected. After making three sets of data based on closest months, highest correlation and subjective choice,<br />
the prediction equations were derived by using selected predictors in the multiple linear regression applying the<br />
30 year moving window method-after creating a prediction value, produces prediction value with a same method by<br />
moving one year by one year, and the combination of independent variables with the lowest root prediction error of<br />
sum of squares (RPRESS) from all the possible combinations was selected. In addition, to reduce the uncertainty of<br />
forecast existing when predicting by a single prediction value, the ensemble model of 60 members for the frequency<br />
of tropical cyclones was predicted by differentiating validation periods. From 1972 to <strong>200</strong>4 typhoon data reported at<br />
RSMC-Tokyo are used as variables. Using the data such as 500 hPa geopotential height, monthly sea level pressure,<br />
SST, 850 hPa temperature, and 850 hPa meridian velocity from May 1971 to August <strong>200</strong>4, 30 ensemble forecasts are<br />
made for predicting typhoon activity. Fig. 2.27 shows the flow chart for processing the statistical model.<br />
TC, TY, and NTA index are ensemble predicted by a statistical model in three summer months, fall months, and over<br />
the whole year in WNP and TC that may affect over the Korean Peninsula is also ensemble predicted in three summer<br />
and fall months. Table 2.4 shows the predicted TC, TY, and NTA over the western North Pacific and TC forecasts<br />
!<br />
85