UWM Plan - Municipal Water District of Orange County
UWM Plan - Municipal Water District of Orange County
UWM Plan - Municipal Water District of Orange County

You also want an ePaper? Increase the reach of your titles
YUMPU automatically turns print PDFs into web optimized ePapers that Google loves.
Section 2<br />
<strong>Water</strong> Demand<br />
Demographic Research (CDR) using the California State Department <strong>of</strong> Finance<br />
population data. Based on this information, the MWDOC service area had a population<br />
<strong>of</strong> 1.01 million in 1970, 2.24 million by 2005, and 2.3 million in 2010. This represents an<br />
average growth <strong>of</strong> approximately 2.3% per year. During the 1970s, the population growth<br />
averaged 3.3% per year; while during the 1990s growth averaged 1.7% per year. Many<br />
older cities, especially those in north and central <strong>Orange</strong> <strong>County</strong>, anticipate reaching<br />
build-out in the near-term and, therefore, their population growth will remain relatively<br />
flat over the next 25 years. This, when combined with a relatively young and growing<br />
south <strong>Orange</strong> <strong>County</strong> population, will result in nearly 2.65 million living in the MWDOC<br />
service area by 2035, representing an average growth <strong>of</strong> 0.66% annually. This slower rate<br />
<strong>of</strong> growth is attributed to the build-out <strong>of</strong> the MWDOC service area. Table 2-2 shows the<br />
current and projected population for the MWDOC service area.<br />
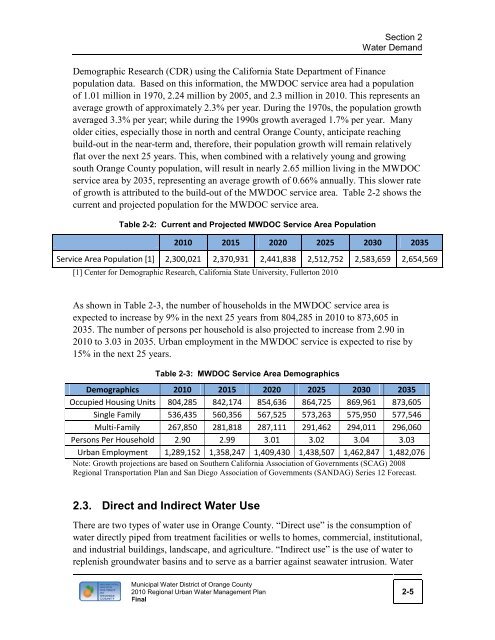
Table 2-2: Current and Projected MWDOC Service Area Population<br />
2010 2015 2020 2025 2030 2035<br />
Service Area Population [1] 2,300,021 2,370,931 2,441,838 2,512,752 2,583,659 2,654,569<br />
[1] Center for Demographic Research, California State University, Fullerton 2010<br />
As shown in Table 2-3, the number <strong>of</strong> households in the MWDOC service area is<br />
expected to increase by 9% in the next 25 years from 804,285 in 2010 to 873,605 in<br />
2035. The number <strong>of</strong> persons per household is also projected to increase from 2.90 in<br />
2010 to 3.03 in 2035. Urban employment in the MWDOC service is expected to rise by<br />
15% in the next 25 years.<br />
Table 2-3: MWDOC Service Area Demographics<br />
Demographics 2010 2015 2020 2025 2030 2035<br />
Occupied Housing Units 804,285 842,174 854,636 864,725 869,961 873,605<br />
Single Family 536,435 560,356 567,525 573,263 575,950 577,546<br />
Multi-Family 267,850 281,818 287,111 291,462 294,011 296,060<br />
Persons Per Household 2.90 2.99 3.01 3.02 3.04 3.03<br />
Urban Employment 1,289,152 1,358,247 1,409,430 1,438,507 1,462,847 1,482,076<br />
Note: Growth projections are based on Southern California Association <strong>of</strong> Governments (SCAG) 2008<br />
Regional Transportation <strong>Plan</strong> and San Diego Association <strong>of</strong> Governments (SANDAG) Series 12 Forecast.<br />
2.3. Direct and Indirect <strong>Water</strong> Use<br />
There are two types <strong>of</strong> water use in <strong>Orange</strong> <strong>County</strong>. “Direct use” is the consumption <strong>of</strong><br />
water directly piped from treatment facilities or wells to homes, commercial, institutional,<br />
and industrial buildings, landscape, and agriculture. “Indirect use” is the use <strong>of</strong> water to<br />
replenish groundwater basins and to serve as a barrier against seawater intrusion. <strong>Water</strong><br />
<strong>Municipal</strong> <strong>Water</strong> <strong>District</strong> <strong>of</strong> <strong>Orange</strong> <strong>County</strong><br />
2010 Regional Urban <strong>Water</strong> Management <strong>Plan</strong><br />
Final<br />
2-5