2010-11 Annual Report - Taranaki District Health Board
2010-11 Annual Report - Taranaki District Health Board
2010-11 Annual Report - Taranaki District Health Board

Create successful ePaper yourself
Turn your PDF publications into a flip-book with our unique Google optimized e-Paper software.
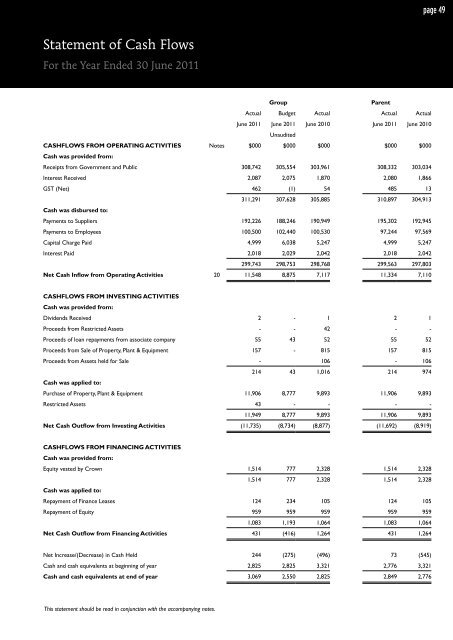
page 49<br />
Statement of Cash Flows<br />
For the Year Ended 30 June 20<strong>11</strong><br />
Group<br />
Parent<br />
Actual Budget Actual Actual Actual<br />
June 20<strong>11</strong> June 20<strong>11</strong> June <strong>2010</strong> June 20<strong>11</strong> June <strong>2010</strong><br />
Unaudited<br />
CASHFLOWS FROM OPERATING ACTIVITIES Notes $000 $000 $000 $000 $000<br />
Cash was provided from:<br />
Receipts from Government and Public 308,742 305,554 303,961 308,332 303,034<br />
Interest Received 2,087 2,075 1,870 2,080 1,866<br />
GST (Net) 462 (1) 54 485 13<br />
3<strong>11</strong>,291 307,628 305,885 310,897 304,913<br />
Cash was disbursed to:<br />
Payments to Suppliers 192,226 188,246 190,949 195,302 192,945<br />
Payments to Employees 100,500 102,440 100,530 97,244 97,569<br />
Capital Charge Paid 4,999 6,038 5,247 4,999 5,247<br />
Interest Paid 2,018 2,029 2,042 2,018 2,042<br />
299,743 298,753 298,768 299,563 297,803<br />
Net Cash Inflow from Operating Activities 20 <strong>11</strong>,548 8,875 7,<strong>11</strong>7 <strong>11</strong>,334 7,<strong>11</strong>0<br />
CASHFLOWS FROM INVESTING ACTIVITIES<br />
Cash was provided from:<br />
Dividends Received 2 - 1 2 1<br />
Proceeds from Restricted Assets - - 42 - -<br />
Proceeds of loan repayments from associate company 55 43 52 55 52<br />
Proceeds from Sale of Property, Plant & Equipment 157 - 815 157 815<br />
Proceeds from Assets held for Sale - 106 - 106<br />
214 43 1,016 214 974<br />
Cash was applied to:<br />
Purchase of Property, Plant & Equipment <strong>11</strong>,906 8,777 9,893 <strong>11</strong>,906 9,893<br />
Restricted Assets 43 - - - -<br />
<strong>11</strong>,949 8,777 9,893 <strong>11</strong>,906 9,893<br />
Net Cash Outflow from Investing Activities (<strong>11</strong>,735) (8,734) (8,877) (<strong>11</strong>,692) (8,919)<br />
CASHFLOWS FROM FINANCING ACTIVITIES<br />
Cash was provided from:<br />
Equity vested by Crown 1,514 777 2,328 1,514 2,328<br />
1,514 777 2,328 1,514 2,328<br />
Cash was applied to:<br />
Repayment of Finance Leases 124 234 105 124 105<br />
Repayment of Equity 959 959 959 959 959<br />
1,083 1,193 1,064 1,083 1,064<br />
Net Cash Outflow from Financing Activities 431 (416) 1,264 431 1,264<br />
Net Increase/(Decrease) in Cash Held 244 (275) (496) 73 (545)<br />
Cash and cash equivalents at beginning of year 2,825 2,825 3,321 2,776 3,321<br />
Cash and cash equivalents at end of year 3,069 2,550 2,825 2,849 2,776<br />
This statement should be read in conjunction with the accompanying notes.