Notional Field Development Final Report - EBN
Notional Field Development Final Report - EBN
Notional Field Development Final Report - EBN

Create successful ePaper yourself
Turn your PDF publications into a flip-book with our unique Google optimized e-Paper software.
<strong>EBN</strong> <strong>Notional</strong> <strong>Field</strong> <strong>Development</strong> Plan<br />
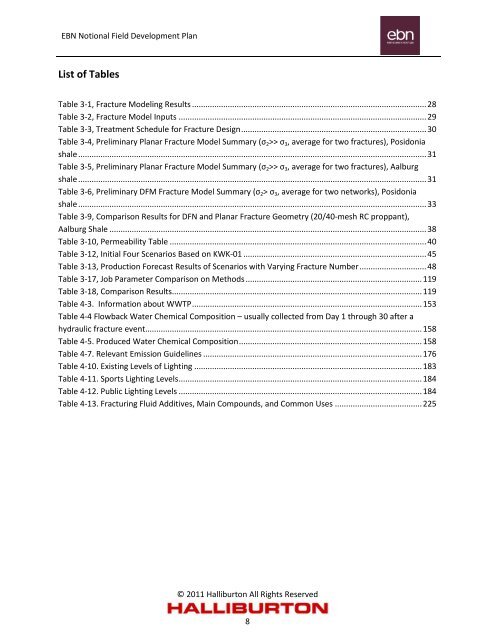
List of Tables<br />
Table 3-1, Fracture Modeling Results ......................................................................................................... 28<br />
Table 3-2, Fracture Model Inputs ............................................................................................................... 29<br />
Table 3-3, Treatment Schedule for Fracture Design ................................................................................... 30<br />
Table 3-4, Preliminary Planar Fracture Model Summary (σ 2 >> σ 3 , average for two fractures), Posidonia<br />
shale ............................................................................................................................................................ 31<br />
Table 3-5, Preliminary Planar Fracture Model Summary (σ 2 >> σ 3 , average for two fractures), Aalburg<br />
shale ............................................................................................................................................................ 31<br />
Table 3-6, Preliminary DFM Fracture Model Summary (σ 2 > σ 3 , average for two networks), Posidonia<br />
shale ............................................................................................................................................................ 33<br />
Table 3-9, Comparison Results for DFN and Planar Fracture Geometry (20/40-mesh RC proppant),<br />
Aalburg Shale .............................................................................................................................................. 38<br />
Table 3-10, Permeability Table ................................................................................................................... 40<br />
Table 3-12, Initial Four Scenarios Based on KWK-01 .................................................................................. 45<br />
Table 3-13, Production Forecast Results of Scenarios with Varying Fracture Number .............................. 48<br />
Table 3-17, Job Parameter Comparison on Methods ............................................................................... 119<br />
Table 3-18, Comparison Results................................................................................................................ 119<br />
Table 4-3. Information about WWTP ....................................................................................................... 153<br />
Table 4-4 Flowback Water Chemical Composition – usually collected from Day 1 through 30 after a<br />
hydraulic fracture event............................................................................................................................ 158<br />
Table 4-5. Produced Water Chemical Composition .................................................................................. 158<br />
Table 4-7. Relevant Emission Guidelines .................................................................................................. 176<br />
Table 4-10. Existing Levels of Lighting ...................................................................................................... 183<br />
Table 4-11. Sports Lighting Levels ............................................................................................................. 184<br />
Table 4-12. Public Lighting Levels ............................................................................................................. 184<br />
Table 4-13. Fracturing Fluid Additives, Main Compounds, and Common Uses ....................................... 225<br />
© 2011 Halliburton All Rights Reserved<br />
8