

Caché Monitoring Guide - InterSystems Documentation
Caché Monitoring Guide - InterSystems Documentation
Caché Monitoring Guide - InterSystems Documentation

Create successful ePaper yourself
Turn your PDF publications into a flip-book with our unique Google optimized e-Paper software.
<strong>Caché</strong> Application Monitor<br />
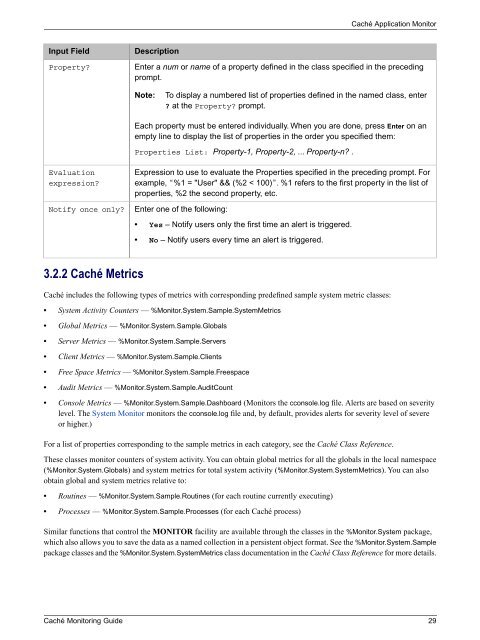
Input Field<br />
Property<br />
Description<br />
Enter a num or name of a property defined in the class specified in the preceding<br />
prompt.<br />
Note:<br />
To display a numbered list of properties defined in the named class, enter<br />
at the Property prompt.<br />
Each property must be entered individually. When you are done, press Enter on an<br />
empty line to display the list of properties in the order you specified them:<br />
Properties List: Property-1, Property-2, ... Property-n .<br />
Evaluation<br />
expression<br />
Notify once only<br />
Expression to use to evaluate the Properties specified in the preceding prompt. For<br />
example, “%1 = "User" && (%2 < 100)”. %1 refers to the first property in the list of<br />
properties, %2 the second property, etc.<br />
Enter one of the following:<br />
• Yes – Notify users only the first time an alert is triggered.<br />
• No – Notify users every time an alert is triggered.<br />
3.2.2 <strong>Caché</strong> Metrics<br />
<strong>Caché</strong> includes the following types of metrics with corresponding predefined sample system metric classes:<br />
• System Activity Counters — %Monitor.System.Sample.SystemMetrics<br />
• Global Metrics — %Monitor.System.Sample.Globals<br />
• Server Metrics — %Monitor.System.Sample.Servers<br />
• Client Metrics — %Monitor.System.Sample.Clients<br />
• Free Space Metrics — %Monitor.System.Sample.Freespace<br />
• Audit Metrics — %Monitor.System.Sample.AuditCount<br />
• Console Metrics — %Monitor.System.Sample.Dashboard (Monitors the cconsole.log file. Alerts are based on severity<br />
level. The System Monitor monitors the cconsole.log file and, by default, provides alerts for severity level of severe<br />
or higher.)<br />
For a list of properties corresponding to the sample metrics in each category, see the <strong>Caché</strong> Class Reference.<br />
These classes monitor counters of system activity. You can obtain global metrics for all the globals in the local namespace<br />
(%Monitor.System.Globals) and system metrics for total system activity (%Monitor.System.SystemMetrics). You can also<br />
obtain global and system metrics relative to:<br />
• Routines — %Monitor.System.Sample.Routines (for each routine currently executing)<br />
• Processes — %Monitor.System.Sample.Processes (for each <strong>Caché</strong> process)<br />
Similar functions that control the MONITOR facility are available through the classes in the %Monitor.System package,<br />
which also allows you to save the data as a named collection in a persistent object format. See the %Monitor.System.Sample<br />
package classes and the %Monitor.System.SystemMetrics class documentation in the <strong>Caché</strong> Class Reference for more details.<br />
<strong>Caché</strong> <strong>Monitoring</strong> <strong>Guide</strong> 29


