

Caché Monitoring Guide - InterSystems Documentation
Caché Monitoring Guide - InterSystems Documentation
Caché Monitoring Guide - InterSystems Documentation

Create successful ePaper yourself
Turn your PDF publications into a flip-book with our unique Google optimized e-Paper software.
Examining Routine Performance Using ^%SYS.MONLBL<br />
This is the complete sample report.<br />
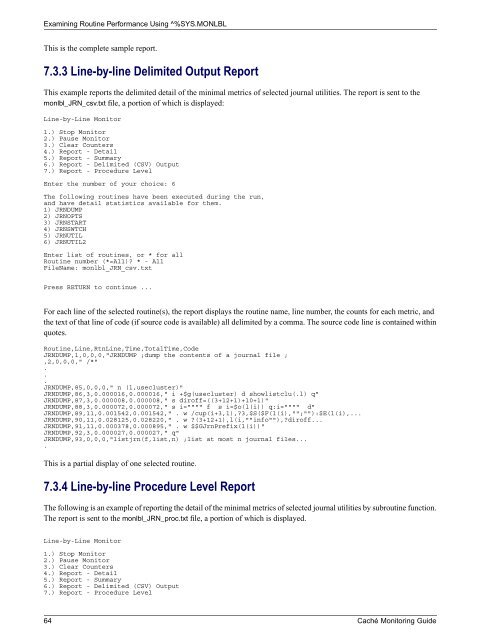
7.3.3 Line-by-line Delimited Output Report<br />
This example reports the delimited detail of the minimal metrics of selected journal utilities. The report is sent to the<br />
monlbl_JRN_csv.txt file, a portion of which is displayed:<br />
Line-by-Line Monitor<br />
1.) Stop Monitor<br />
2.) Pause Monitor<br />
3.) Clear Counters<br />
4.) Report - Detail<br />
5.) Report - Summary<br />
6.) Report - Delimited (CSV) Output<br />
7.) Report - Procedure Level<br />
Enter the number of your choice: 6<br />
The following routines have been executed during the run,<br />
and have detail statistics available for them.<br />
1) JRNDUMP<br />
2) JRNOPTS<br />
3) JRNSTART<br />
4) JRNSWTCH<br />
5) JRNUTIL<br />
6) JRNUTIL2<br />
Enter list of routines, or * for all<br />
Routine number (*=All) * - All<br />
FileName: monlbl_JRN_csv.txt<br />
Press RETURN to continue ...<br />
For each line of the selected routine(s), the report displays the routine name, line number, the counts for each metric, and<br />
the text of that line of code (if source code is available) all delimited by a comma. The source code line is contained within<br />
quotes.<br />
Routine,Line,RtnLine,Time,TotalTime,Code<br />
JRNDUMP,1,0,0,0,"JRNDUMP ;dump the contents of a journal file ;<br />
,2,0,0,0," /*"<br />
.<br />
.<br />
.<br />
JRNDUMP,85,0,0,0," n (l,usecluster)"<br />
JRNDUMP,86,3,0.000016,0.000016," i +$g(usecluster) d showlistclu(.l) q"<br />
JRNDUMP,87,3,0.000008,0.000008," s diroff=((3+12+1)+10+1)"<br />
JRNDUMP,88,3,0.000072,0.000072," s i="""" f s i=$o(l(i)) q:i="""" d"<br />
JRNDUMP,89,11,0.001542,0.001542," . w /cup(i+3,1),3,$S($F(l(i),"";""):$E(l(i),...<br />
JRNDUMP,90,11,0.028125,0.028220," . w (3+12+1),l(i,""info""),diroff...<br />
JRNDUMP,91,11,0.000378,0.000895," . w $$GJrnPrefix(l(i))"<br />
JRNDUMP,92,3,0.000027,0.000027," q"<br />
JRNDUMP,93,0,0,0,"listjrn(f,list,n) ;list at most n journal files...<br />
.<br />
This is a partial display of one selected routine.<br />
7.3.4 Line-by-line Procedure Level Report<br />
The following is an example of reporting the detail of the minimal metrics of selected journal utilities by subroutine function.<br />
The report is sent to the monlbl_JRN_proc.txt file, a portion of which is displayed.<br />
Line-by-Line Monitor<br />
1.) Stop Monitor<br />
2.) Pause Monitor<br />
3.) Clear Counters<br />
4.) Report - Detail<br />
5.) Report - Summary<br />
6.) Report - Delimited (CSV) Output<br />
7.) Report - Procedure Level<br />
64 <strong>Caché</strong> <strong>Monitoring</strong> <strong>Guide</strong>


