

Caché Monitoring Guide - InterSystems Documentation
Caché Monitoring Guide - InterSystems Documentation
Caché Monitoring Guide - InterSystems Documentation

Create successful ePaper yourself
Turn your PDF publications into a flip-book with our unique Google optimized e-Paper software.
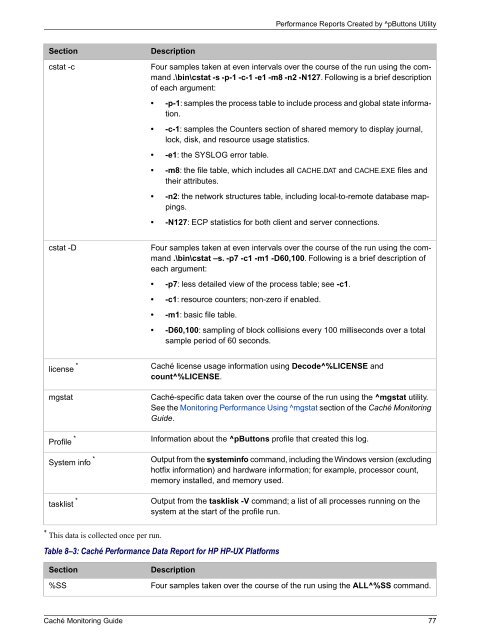
Performance Reports Created by ^pButtons Utility<br />
Section<br />
cstat -c<br />
Description<br />
Four samples taken at even intervals over the course of the run using the command<br />
.\bin\cstat -s -p-1 -c-1 -e1 -m8 -n2 -N127. Following is a brief description<br />
of each argument:<br />
• -p-1: samples the process table to include process and global state information.<br />
• -c-1: samples the Counters section of shared memory to display journal,<br />
lock, disk, and resource usage statistics.<br />
• -e1: the SYSLOG error table.<br />
• -m8: the file table, which includes all CACHE.DAT and CACHE.EXE files and<br />
their attributes.<br />
• -n2: the network structures table, including local-to-remote database mappings.<br />
• -N127: ECP statistics for both client and server connections.<br />
cstat -D<br />
Four samples taken at even intervals over the course of the run using the command<br />
.\bin\cstat –s. -p7 -c1 -m1 -D60,100. Following is a brief description of<br />
each argument:<br />
• -p7: less detailed view of the process table; see -c1.<br />
• -c1: resource counters; non-zero if enabled.<br />
• -m1: basic file table.<br />
• -D60,100: sampling of block collisions every 100 milliseconds over a total<br />
sample period of 60 seconds.<br />
license *<br />
mgstat<br />
Profile *<br />
System info *<br />
tasklist *<br />
<strong>Caché</strong> license usage information using Decode^%LICENSE and<br />
count^%LICENSE.<br />
<strong>Caché</strong>-specific data taken over the course of the run using the ^mgstat utility.<br />
See the <strong>Monitoring</strong> Performance Using ^mgstat section of the <strong>Caché</strong> <strong>Monitoring</strong><br />
<strong>Guide</strong>.<br />
Information about the ^pButtons profile that created this log.<br />
Output from the systeminfo command, including the Windows version (excluding<br />
hotfix information) and hardware information; for example, processor count,<br />
memory installed, and memory used.<br />
Output from the tasklisk -V command; a list of all processes running on the<br />
system at the start of the profile run.<br />
* This data is collected once per run.<br />
Table 8–3: <strong>Caché</strong> Performance Data Report for HP HP-UX Platforms<br />
Section<br />
%SS<br />
Description<br />
Four samples taken over the course of the run using the ALL^%SS command.<br />
<strong>Caché</strong> <strong>Monitoring</strong> <strong>Guide</strong> 77


