

Caché Monitoring Guide - InterSystems Documentation
Caché Monitoring Guide - InterSystems Documentation
Caché Monitoring Guide - InterSystems Documentation

You also want an ePaper? Increase the reach of your titles
YUMPU automatically turns print PDFs into web optimized ePapers that Google loves.
<strong>Monitoring</strong> Performance Using ^pButtons<br />
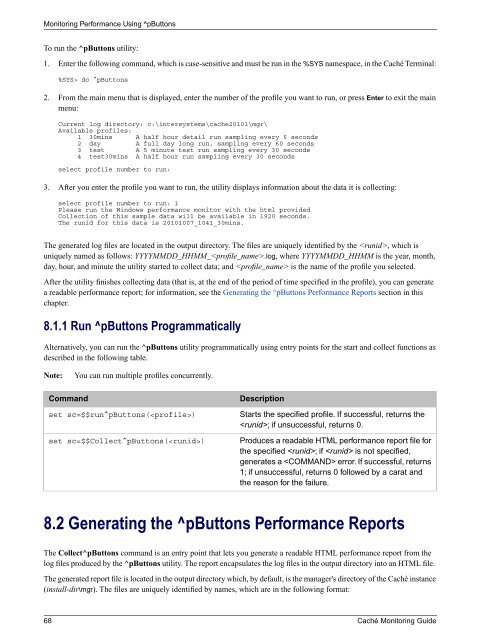
To run the ^pButtons utility:<br />
1. Enter the following command, which is case-sensitive and must be run in the %SYS namespace, in the <strong>Caché</strong> Terminal:<br />
%SYS> do ^pButtons<br />
2. From the main menu that is displayed, enter the number of the profile you want to run, or press Enter to exit the main<br />
menu:<br />
Current log directory: c:\intersystems\cache20101\mgr\<br />
Available profiles:<br />
1 30mins A half hour detail run sampling every 5 seconds<br />
2 day A full day long run, sampling every 60 seconds<br />
3 test A 5 minute test run sampling every 30 seconds<br />
4 test30mins A half hour run sampling every 30 seconds<br />
select profile number to run:<br />
3. After you enter the profile you want to run, the utility displays information about the data it is collecting:<br />
select profile number to run: 1<br />
Please run the Windows performance monitor with the html provided<br />
Collection of this sample data will be available in 1920 seconds.<br />
The runid for this data is 20101007_1041_30mins.<br />
The generated log files are located in the output directory. The files are uniquely identified by the , which is<br />
uniquely named as follows: YYYYMMDD_HHMM_.log, where YYYYMMDD_HHMM is the year, month,<br />
day, hour, and minute the utility started to collect data; and is the name of the profile you selected.<br />
After the utility finishes collecting data (that is, at the end of the period of time specified in the profile), you can generate<br />
a readable performance report; for information, see the Generating the ^pButtons Performance Reports section in this<br />
chapter.<br />
8.1.1 Run ^pButtons Programmatically<br />
Alternatively, you can run the ^pButtons utility programmatically using entry points for the start and collect functions as<br />
described in the following table.<br />
Note:<br />
You can run multiple profiles concurrently.<br />
Command<br />
set sc=$$run^pButtons()<br />
set sc=$$Collect^pButtons()<br />
Description<br />
Starts the specified profile. If successful, returns the<br />
; if unsuccessful, returns 0.<br />
Produces a readable HTML performance report file for<br />
the specified ; if is not specified,<br />
generates a error. If successful, returns<br />
1; if unsuccessful, returns 0 followed by a carat and<br />
the reason for the failure.<br />
8.2 Generating the ^pButtons Performance Reports<br />
The Collect^pButtons command is an entry point that lets you generate a readable HTML performance report from the<br />
log files produced by the ^pButtons utility. The report encapsulates the log files in the output directory into an HTML file.<br />
The generated report file is located in the output directory which, by default, is the manager's directory of the <strong>Caché</strong> instance<br />
(install-dir\mgr). The files are uniquely identified by names, which are in the following format:<br />
68 <strong>Caché</strong> <strong>Monitoring</strong> <strong>Guide</strong>


