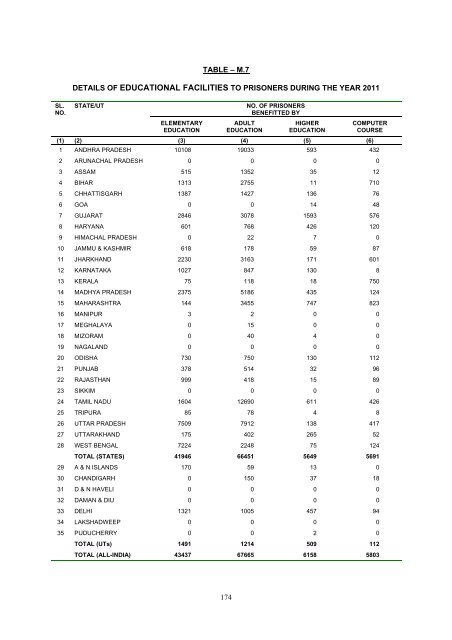
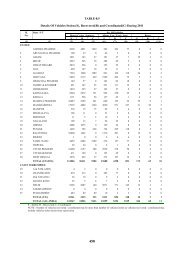
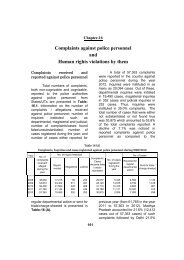
SL. NO. TABLE – M.7 DETAILS OF EDUCATIONAL FACILITIES TO PRISONERS DURING THE YEAR <strong>2011</strong> STATE/UT ELEMENTARY EDUCATION ADULT EDUCATION NO. OF PRISONERS BENEFITTED BY HIGHER EDUCATION COMPUTER COURSE (1) (2) (3) (4) (5) (6) 1 ANDHRA PRADESH 10108 19033 593 432 2 ARUNACHAL PRADESH 0 0 0 0 3 ASSAM 515 1352 35 12 4 BIHAR 1313 2755 11 710 5 CHHATTISGARH 1387 1427 136 76 6 GOA 0 0 14 48 7 GUJARAT 2846 3078 1593 576 8 HARYANA 601 768 426 120 9 HIMACHAL PRADESH 0 22 7 0 10 JAMMU & KASHMIR 618 178 59 87 11 JHARKHAND 2230 3163 171 601 12 KARNATAKA 1027 847 130 8 13 KERALA 75 118 18 750 14 MADHYA PRADESH 2375 5186 435 124 15 MAHARASHTRA 144 3455 747 823 16 MANIPUR 3 2 0 0 17 MEGHALAYA 0 15 0 0 18 MIZORAM 0 40 4 0 19 NAGALAND 0 0 0 0 20 ODISHA 730 750 130 112 21 PUNJAB 378 514 32 96 22 RAJASTHAN 999 418 15 89 23 SIKKIM 0 0 0 0 24 TAMIL NADU 1604 12690 611 426 25 TRIPURA 85 78 4 8 26 UTTAR PRADESH 7509 7912 138 417 27 UTTARAKHAND 175 402 265 52 28 WEST BENGAL 7224 2248 75 124 TOTAL (STATES) 41946 66451 5649 5691 29 A & N ISLANDS 170 59 13 0 30 CHANDIGARH 0 150 37 18 31 D & N HAVELI 0 0 0 0 32 DAMAN & DIU 0 0 0 0 33 DELHI 1321 1005 457 94 34 LAKSHADWEEP 0 0 0 0 35 PUDUCHERRY 0 0 2 0 TOTAL (UTs) 1491 1214 509 112 TOTAL (ALL-INDIA) 43437 67665 6158 5803 174
Index B Borstal School, 1, 2, 3, 29 Budget, 157, 158, 159 C Capacity, 1, 2, 3, 15, 16 Central Jail, 1, 29, 31 Civil Prisoners, 30, 31, 32 Convicted Civil Prisoners, 31 Convicts, 29, 30, 32, 73, 74, 75, 95, 117 D Deaths in jail, 133 Detenues, 29, 31, 32, 96 District Jail, 1, 2, 29, 30, 31 E Earning, 127 Educational facilities, 159 Ex-officio Visitors, 137 Expenses on Prison Inmates, 159 F Foreigner convicts, 32 Foreigners, 32, 73 I Inspections, 137 IPC crimes, 73, 75 J Jail Officials, 139, 140, 141 Jails, 1, 2, 3, 15, 16, 29, 30, 31, 32, 73, 75, 95, 96, 111, 117, 127, 133, 137, 139, 140, 157 M Mentally ill Prisoners, 31 N Non-Official Visitors, 137 Non-Plan Expenditure, 157, 158, 159 O Open Jail, 1, 3, 29 Other Jails, 1, 3, 29 P Plan Expenditure, 157, 158, 159 S Special and Local Laws, 73, 74, 75 Special Jails, 1, 3, 29 Sub Jail, 1, 2, 29, 31 T Training of Jail Staff, 140 U Undertrial Civil Prisoners, 31, 32 Undertrials, 29, 30, 31, 32, 73, 74, 75, 95, 96, 111 V Vocational Training, 2, 127, 128 W Women Jail, 1, 2, 29, 31, 140
- Page 3:
PRISON STATISTICS INDIA 2011 Nation
- Page 8 and 9:
are summarised in Snapshots. In kee
- Page 10 and 11:
OFFICERS & OFFICIALS ASSOCIATED WIT
- Page 12 and 13:
DISCLAIMER • The information publ
- Page 14 and 15:
Murder alone accounted for 58.0% (6
- Page 16 and 17:
Rate of change in number of Undertr
- Page 18 and 19:
DISTRICT JAILS IN INDIA DURING 2011
- Page 20 and 21:
WOMEN JAILS IN INDIA DURING 2011 Ja
- Page 22 and 23:
OCCUPANCY RATE AS ON 31.12.2011 Jam
- Page 24 and 25:
UNDERTRIALS IN INDIA AS ON 31.12.20
- Page 26 and 27:
FEMALE UNDERTRIALS AS ON 31.12.2011
- Page 28 and 29:
MENTALLY ILL PRISONERS AS ON 31.12.
- Page 30 and 31:
Chapter & Table No. 3.7 Title C O N
- Page 32 and 33:
Chapter & Table No. Title C O N T E
- Page 34 and 35:
Punjab (8,614), Rajasthan (8,118),
- Page 36 and 37:
Number of Total Jails in States and
- Page 38 and 39:
Total Capacity of All Central Jails
- Page 40 and 41:
Total Capacity of All Sub Jails in
- Page 42 and 43:
SL. NO. TABLE - 1.2 STATE/UT WISE D
- Page 44 and 45:
TABLE - 1.4 CATEGORY WISE DISTRIBUT
- Page 46 and 47:
Age Group-wise Distribution of diff
- Page 48 and 49:
It is evident as per the informatio
- Page 50 and 51:
18 168.8 222.7 256.3 237.0 194.0 17
- Page 52 and 53:
SL. NO TABLE - 2.1 CAPACITY OF JAIL
- Page 54 and 55:
SL. NO. TABLE - 2.3 CAPACITY AND PO
- Page 56 and 57:
SL. NO. TABLE - 2.5 CAPACITY AND PO
- Page 58 and 59:
SL. NO. TABLE - 2.7 CAPACITY AND PO
- Page 60 and 61:
SL. NO. TABLE - 2.9 CAPACITY AND PO
- Page 62 and 63:
undertrial prisoners in various jai
- Page 64 and 65:
prisoners in the country followed b
- Page 66 and 67:
34 100 90 80 70 60 50 40 30 20 10 0
- Page 68 and 69:
TABLE - 3.2 STATE/UT-WISE DISTRIBUT
- Page 70 and 71:
TABLE - 3.3 (Concluded) SL. STATE/U
- Page 72 and 73:
TABLE - 3.5 STATE/UT-WISE AND SEX-W
- Page 74 and 75:
TABLE - 3.6 STATE/UT-WISE AND SEX-W
- Page 76 and 77:
TABLE - 3.7 STATE/UT-WISE AND SEX-W
- Page 78 and 79:
TABLE - 3.8 STATE/UT-WISE DISTRIBUT
- Page 80 and 81:
TABLE - 3.9 (Concluded) SL. NO. STA
- Page 82 and 83:
TABLE - 3.10 (Concluded) SL. NO. ST
- Page 84 and 85:
TABLE - 3.11 (Concluded) SL. NO. ST
- Page 86 and 87:
TABLE 3.12 (Concluded) SL. NO. STAT
- Page 88 and 89:
TABLE - 3.13 (Concluded) SL. NO STA
- Page 90 and 91:
TABLE - 3.15 STATE/UT-WISE DISTRIBU
- Page 92 and 93:
TABLE - 3.16 STATE/UT-WISE PERCENTA
- Page 94 and 95:
TABLE - 3.17 (Concluded) SL. NO. ST
- Page 96 and 97:
TABLE - 3.19 STATE/UT-WISE DISTRIBU
- Page 98 and 99:
TABLE - 3.20 STATE/UT-WISE PERCENTA
- Page 100 and 101:
TABLE - 3.21 (Concluded) SL. NO. ST
- Page 102 and 103:
TABLE - 3.23 STATE/UT-WISE DISTRIBU
- Page 104 and 105:
SL. NO. STATE/UT TABLE - 3.25 INCID
- Page 106 and 107:
eported from Uttar Pradesh while lo
- Page 108 and 109:
Distribution of Convict Prisoners u
- Page 110 and 111:
4638 ANDHRA PRADESH 8544 6 ARUNACHA
- Page 112 and 113:
TABLE - 4.1 (Continued) SL. NO. STA
- Page 114 and 115:
TABLE - 4.2 STATE/UT-WISE NUMBER OF
- Page 116 and 117:
TABLE - 4.2 (Concluded) CONSER- VAT
- Page 118 and 119:
TABLE - 4.3 (Continued) SL. NO. STA
- Page 120 and 121:
TABLE - 4.4 STATE/UT-WISE NUMBER OF
- Page 122 and 123:
TABLE - 4.4 (Concluded) CONSER- VAT
- Page 124 and 125:
TABLE - 4.6 DETAILS OF UNDERTRIALS
- Page 126 and 127:
TABLE - 4.8 DETAILS OF PERSONS RELE
- Page 128 and 129:
91.6% undertrial prisoners were fou
- Page 130 and 131:
Caste-wise Distribution of Inmates
- Page 132 and 133:
TABLE - 5.1 (Continued) SL. NO. STA
- Page 134 and 135:
TABLE - 5.2 DEMOGRAPHIC PARTICULARS
- Page 136 and 137:
TABLE - 5.2 (Concluded) SL. NO. STA
- Page 138 and 139:
TABLE - 5.3 (Continued) SL. NO. STA
- Page 140 and 141:
TABLE - 5.4 DEMOGRAPHIC PARTICULARS
- Page 142 and 143:
TABLE - 5.4 (Concluded) SL. NO. STA
- Page 144 and 145:
Percentage Distribution of Undertri
- Page 146 and 147:
TABLE - 6.1 NUMBER OF UNDERTRIAL PR
- Page 148 and 149:
SL. NO . TABLE - 6.2 PERCENTAGE OF
- Page 150 and 151:
Percentage Distribution of Convicts
- Page 152 and 153:
120 Gender-wise Life Imprisonment C
- Page 154 and 155:
TABLE - 7.1 (Continued) SL. NO. STA
- Page 156 and 157: SL. NO. TABLE - 7.2 PERCENTAGE OF C
- Page 158 and 159: SL. NO. STATE/UT TABLE - 7.3 DETAIL
- Page 160 and 161: Table 8(A) Vocational Training Avai
- Page 162 and 163: 130 Chart 8.3 Inmate Population vs
- Page 164 and 165: TABLE - 8.2 STATE/UT-WISE VALUE OF
- Page 166 and 167: State/UT-wise Natural Deaths of Inm
- Page 168 and 169: TABLE - 9.2 STATE/UT-WISE INCIDENCE
- Page 170 and 171: TABLE - 10.1 STATE/UT-WISE NUMBER O
- Page 172 and 173: administration of jail institutions
- Page 174 and 175: Percentage of Various type of Jail
- Page 176 and 177: Sanctioned & Actual Strength of Jai
- Page 178 and 179: TABLE - 11.1 SANCTIONED AND ACTUAL
- Page 180 and 181: TABLE - 11.1 (Continued) SL. STATE/
- Page 182 and 183: TABLE - 11.1 (Concluded) SL. NO. ST
- Page 184 and 185: TABLE - 11.2 (Concluded) SL. NO STA
- Page 186 and 187: TABLE - 11.4 DETAILS OF QUARTERS AV
- Page 188 and 189: TABLE - 11.4 (Concluded) SL. STATE/
- Page 190 and 191: Plan Expenditure and Non-Plan Expen
- Page 192 and 193: 17902.8 15628.3 160 17582.2 13551.0
- Page 194 and 195: 162 Chart 12.4 4 0 0 0 0 0 0 5 63 5
- Page 196 and 197: TABLE - 12.2 STATE/UT-WISE DETAILS
- Page 198 and 199: TABLE - 12.4 DETAILS OF ELECTRONIC
- Page 200 and 201: SL. NO. STATE/UT TABLE - M.2 DETAIL
- Page 202 and 203: TABLE - M.4 INCIDENCE OF JAIL BREAK
- Page 204 and 205: TABLE - M.5 (Concluded) SL. NO. STA
- Page 209: Sender(s) Name & Full Address (Opti