prison statistics india 2011 - National Crime Records Bureau
prison statistics india 2011 - National Crime Records Bureau
prison statistics india 2011 - National Crime Records Bureau
- No tags were found...

Create successful ePaper yourself
Turn your PDF publications into a flip-book with our unique Google optimized e-Paper software.
CHAPTER - 3<br />
TYPES OF PRISON INMATES<br />
Prison inmates lodged in various<br />
jails are categorised as Convicts,<br />
Undertrials and Detenues. The percentage<br />
share of Convicts, Undertrials and<br />
Detenues inmates was reported as 34.5%,<br />
64.7% & 0.7% respectively at the end of<br />
<strong>2011</strong>.<br />
Convicts (1,28,592)<br />
Uttar Pradesh accounted for the<br />
highest number of convicted <strong>prison</strong>ers<br />
(28,051) at the end of <strong>2011</strong> among the<br />
States & UTs. Other States which have<br />
reported considerably large number of<br />
convicts were Madhya Pradesh (15,956),<br />
Maharashtra (7,952), Punjab (7,526),<br />
Haryana (6,529), Rajasthan (6,159), West<br />
Bengal (5,660), Chhattisgarh (5,630),<br />
Tamil Nadu (5,200), Andhra Pradesh<br />
(4,638), Bihar (4,594) and Gujarat (4,504)<br />
(Table-3.1).<br />
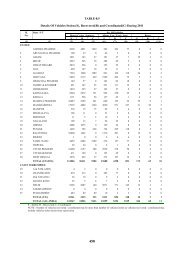
The State/UT wise distribution of<br />
convicts lodged in different jails is<br />
presented in Table 3.1. Central Jails<br />
accommodated more than 2/3rd of<br />
convicted <strong>prison</strong>ers in Chhattisgarh<br />
(97.0%), Karnataka (96.5%), Tamil Nadu<br />
(95.3%), Jharkhand (93.5%), Delhi<br />
(91.4%), Maharashtra and Andhra<br />
Pradesh (83.4% each), Goa (81.9%),<br />
Kerala (80.2%), Gujarat (80.1%),<br />
Rajasthan (74.7%), Madhya Pradesh<br />
(74.3%) and Punjab (71.3%) at the end of<br />
the year <strong>2011</strong>.<br />
District Jails of Uttar Pradesh<br />
(15,307), Haryana (5,322), Madhya<br />
Pradesh (3,039), Assam (1,738), Punjab<br />
(1,566), Odisha (1,474) and Bihar (1,361)<br />
catered to a large number of convicted<br />
<strong>prison</strong>ers.<br />
The number of convicts in subjails<br />
was higher in Madhya Pradesh<br />
(1,045) and Odisha (1,041).<br />
Inspite of having only 1 Borstal<br />
School each in Punjab and Haryana, the<br />
maximum convicts were reported in<br />
Punjab (123) and Haryana (86).<br />
The Open Jails located in<br />
Maharashtra have lodged 782 of convicts<br />
followed by Rajasthan (557), Kerala (308),<br />
Andhra Pradesh (279) and Uttarakhand<br />
(215).<br />
The highest number of convicts<br />
lodged in Special Jails were reported in<br />
Bihar (722) followed by Uttar Pradesh<br />
(400), Odisha (231) and West Bengal<br />
(124).<br />
The State/UT-wise, Jail-wise and<br />
Gender-wise information on different type of<br />
<strong>prison</strong> inmates are presented in Table-3.5<br />
to Table 3.12. The Central Jails<br />
accommodated higher number of female<br />
convicts in the States of Maharashtra (383),<br />
Madhya Pradesh (304), Punjab (247),<br />
Chhattisgarh (242), Karnataka (187),<br />
Gujarat (173), West Bengal (152) and<br />
Jharkhand (133) (Table-3.5). 570 female<br />
convicts were lodged in district jails of Uttar<br />
Pradesh followed by Haryana (180) and<br />
Madhya Pradesh (138) (Table-3.6).<br />
299 out of 1383 women convicts<br />
were reported from Uttar Pradesh followed<br />
by Rajasthan (211), Tamil Nadu (175),<br />
Andhra Pradesh (165) and West Bengal<br />
(152) in women jails. Delhi is the only UT<br />
having one exclusive women jail and 116<br />
convicts were lodged in it (Table-<br />
3.8/Table-3.1). Out of 1,28,592 convicted<br />
<strong>prison</strong>ers, number of convict inmates<br />
lodged in Central Jails, District Jails, Sub<br />
Jails, Open Jails, Women Jails, Special<br />
Jails, Borstal Jails and Other Jails are<br />
83329, 36064, 3269, 2652, 1383, 1643,<br />
231 and 21 respectively at the end of<br />
<strong>2011</strong>. (Table-3.1).<br />
Undertrials (2,41,200)<br />
Detailed information on Undertrials<br />
lodged in different jails of States and UTs is<br />
given in Table-3.2. The maximum of<br />
29