prison statistics india 2011 - National Crime Records Bureau
prison statistics india 2011 - National Crime Records Bureau
prison statistics india 2011 - National Crime Records Bureau
- No tags were found...

You also want an ePaper? Increase the reach of your titles
YUMPU automatically turns print PDFs into web optimized ePapers that Google loves.
CHAPTER – 2<br />
INMATE POPULATION AND OVERCROWDING IN PRISONS<br />
An important aspect of <strong>prison</strong><br />
administration is the <strong>prison</strong> population that<br />
authorities have to handle in the <strong>prison</strong>s.<br />
One thing that comes out strikingly on the<br />
basis of available data is that the jails are<br />
over crowded.<br />
Data relating to the population of<br />
both male and female inmates are collected<br />
from the <strong>prison</strong> authorities in order to find<br />
the relationship in terms of<br />
occupancy/overcrowding between the<br />
capacity available in <strong>prison</strong>s and the actual<br />
number of <strong>prison</strong> inmates. The occupancy<br />
in any jail changes on daily basis due to<br />
addition of new <strong>prison</strong>ers and release of old<br />
ones, nevertheless, an estimate of<br />
population of inmates at the end of the year<br />
would serve as a good indicator to<br />
determine the occupancy rate. The<br />
occupancy rate defined as number of<br />
inmates staying in jails against the<br />
authorized capacity for 100 inmates has<br />
been calculated to determine the 'Crowding<br />
in Prisons'.<br />
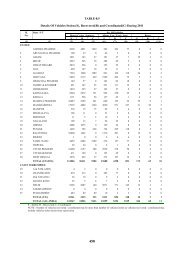
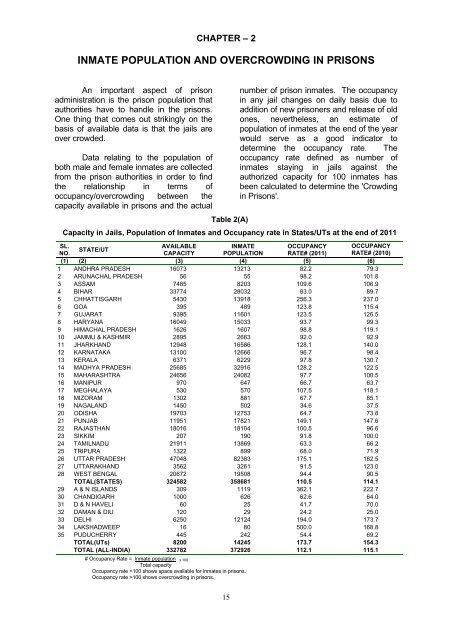
Table 2(A)<br />
Capacity in Jails, Population of Inmates and Occupancy rate in States/UTs at the end of <strong>2011</strong><br />
SL.<br />
AVAILABLE<br />
INMATE<br />
OCCUPANCY OCCUPANCY<br />
STATE/UT<br />
NO.<br />
CAPACITY POPULATION RATE# (<strong>2011</strong>) RATE# (2010)<br />
(1) (2) (3) (4) (5) (6)<br />
1 ANDHRA PRADESH 16073 13213 82.2 79.3<br />
2 ARUNACHAL PRADESH 56 55 98.2 101.8<br />
3 ASSAM 7485 8203 109.6 106.9<br />
4 BIHAR 33774 28032 83.0 89.7<br />
5 CHHATTISGARH 5430 13918 256.3 237.0<br />
6 GOA 395 489 123.8 115.4<br />
7 GUJARAT 9395 11601 123.5 126.5<br />
8 HARYANA 16049 15033 93.7 99.3<br />
9 HIMACHAL PRADESH 1626 1607 98.8 119.1<br />
10 JAMMU & KASHMIR 2895 2663 92.0 92.9<br />
11 JHARKHAND 12948 16586 128.1 140.0<br />
12 KARNATAKA 13100 12666 96.7 98.4<br />
13 KERALA 6371 6229 97.8 130.7<br />
14 MADHYA PRADESH 25685 32916 128.2 122.5<br />
15 MAHARASHTRA 24656 24082 97.7 100.5<br />
16 MANIPUR 970 647 66.7 63.7<br />
17 MEGHALAYA 530 570 107.5 118.1<br />
18 MIZORAM 1302 881 67.7 85.1<br />
19 NAGALAND 1450 502 34.6 37.5<br />
20 ODISHA 19703 12753 64.7 73.8<br />
21 PUNJAB 11951 17821 149.1 147.6<br />
22 RAJASTHAN 18016 18104 100.5 96.6<br />
23 SIKKIM 207 190 91.8 100.0<br />
24 TAMILNADU 21911 13869 63.3 66.2<br />
25 TRIPURA 1322 899 68.0 71.9<br />
26 UTTAR PRADESH 47048 82383 175.1 182.5<br />
27 UTTARAKHAND 3562 3261 91.5 123.0<br />
28 WEST BENGAL 20672 19508 94.4 90.5<br />
TOTAL(STATES) 324582 358681 110.5 114.1<br />
29 A & N ISLANDS 309 1119 362.1 222.7<br />
30 CHANDIGARH 1000 626 62.6 64.0<br />
31 D & N HAVELI 60 25 41.7 70.0<br />
32 DAMAN & DIU 120 29 24.2 25.0<br />
33 DELHI 6250 12124 194.0 173.7<br />
34 LAKSHADWEEP 16 80 500.0 168.8<br />
35 PUDUCHERRY 445 242 54.4 69.2<br />
TOTAL(UTs) 8200 14245 173.7 154.3<br />
TOTAL (ALL-INDIA) 332782 372926 112.1 115.1<br />
# Occupancy Rate = Inmate population x 100<br />
Total capacity<br />
Occupancy rate 100 shows overcrowding in <strong>prison</strong>s.<br />
15