Submitted version of the thesis - Airlab, the Artificial Intelligence ...
Submitted version of the thesis - Airlab, the Artificial Intelligence ...
Submitted version of the thesis - Airlab, the Artificial Intelligence ...

You also want an ePaper? Increase the reach of your titles
YUMPU automatically turns print PDFs into web optimized ePapers that Google loves.
62 Chapter 5. Vision<br />
background is much darker than <strong>the</strong> subject, or when photographing very<br />
dark objects, such as black china on a black tablecloth.<br />
From <strong>the</strong> parameters available in our camera we disabled <strong>the</strong> automatic<br />
exposure by setting DIRECT MANUAL MODE, in which <strong>the</strong> exposure parameters<br />
are input directly and not calculated by <strong>the</strong> camera. We don’t<br />
want <strong>the</strong> camera automatically adjust <strong>the</strong> exposure, since this will cause to<br />
lighten or darken <strong>the</strong> picture dynamically. Instead by setting <strong>the</strong> exposure<br />
directly to a constant value, we ensure that <strong>the</strong> picture will remain with <strong>the</strong><br />
same enlightenment, toge<strong>the</strong>r with <strong>the</strong> target we are searching for.<br />
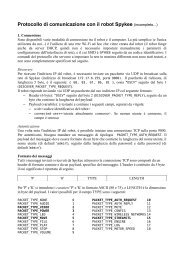
After setting <strong>the</strong> white balance and exposure compensation, we took<br />
sample images (Figure 5.4) in order to define selected object’s color using<br />
<strong>the</strong> script.<br />
Figure 5.4: Samples are taken from different lighting conditions and different distance<br />
to <strong>the</strong> target object<br />
After acquiring <strong>the</strong> samples, <strong>the</strong> next step is creation <strong>of</strong> <strong>the</strong> histogram,<br />
to find <strong>the</strong> distribution <strong>of</strong> <strong>the</strong> RGB values in <strong>the</strong> target object’s color. The<br />
histogram created is shown in Figure 5.5.<br />
An image histogram is a type <strong>of</strong> histogram that acts as a graphical representation<br />
<strong>of</strong> <strong>the</strong> color distribution in a digital image. It plots <strong>the</strong> number <strong>of</strong><br />
pixels for each color value. By looking at <strong>the</strong> histogram for a specific image,