Th`ese Marouan BOUALI - Sites personnels de TELECOM ParisTech
Th`ese Marouan BOUALI - Sites personnels de TELECOM ParisTech
Th`ese Marouan BOUALI - Sites personnels de TELECOM ParisTech

You also want an ePaper? Increase the reach of your titles
YUMPU automatically turns print PDFs into web optimized ePapers that Google loves.
20 2. Remote Sensing with MODIS<br />
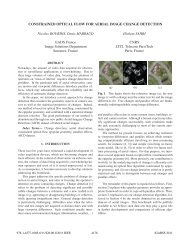
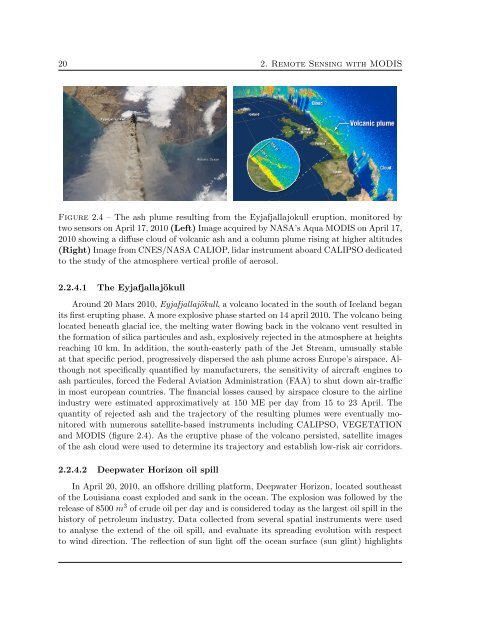
Figure 2.4 – The ash plume resulting from the Eyjafjallajokull eruption, monitored by<br />
two sensors on April 17, 2010 (Left) Image acquired by NASA’s Aqua MODIS on April 17,<br />
2010 showing a diffuse cloud of volcanic ash and a column plume rising at higher altitu<strong>de</strong>s<br />
(Right) Image from CNES/NASA CALIOP, lidar instrument aboard CALIPSO <strong>de</strong>dicated<br />
to the study of the atmosphere vertical profile of aerosol.<br />
2.2.4.1 The Eyjafjallajökull<br />
Around 20 Mars 2010, Eyjafjallajökull, a volcano located in the south of Iceland began<br />
its first erupting phase. A more explosive phase started on 14 april 2010. The volcano being<br />
located beneath glacial ice, the melting water flowing back in the volcano vent resulted in<br />
the formation of silica particules and ash, explosively rejected in the atmosphere at heights<br />
reaching 10 km. In addition, the south-easterly path of the Jet Stream, unusually stable<br />
at that specific period, progressively dispersed the ash plume across Europe’s airspace. Although<br />
not specifically quantified by manufacturers, the sensitivity of aircraft engines to<br />
ash particules, forced the Fe<strong>de</strong>ral Aviation Administration (FAA) to shut down air-traffic<br />
in most european countries. The financial losses caused by airspace closure to the airline<br />
industry were estimated approximatively at 150 ME per day from 15 to 23 April. The<br />
quantity of rejected ash and the trajectory of the resulting plumes were eventually monitored<br />
with numerous satellite-based instruments including CALIPSO, VEGETATION<br />
and MODIS (figure 2.4). As the eruptive phase of the volcano persisted, satellite images<br />
of the ash cloud were used to <strong>de</strong>termine its trajectory and establish low-risk air corridors.<br />
2.2.4.2 Deepwater Horizon oil spill<br />
In April 20, 2010, an offshore drilling platform, Deepwater Horizon, located southeast<br />
of the Louisiana coast explo<strong>de</strong>d and sank in the ocean. The explosion was followed by the<br />
release of 8500 m 3 of cru<strong>de</strong> oil per day and is consi<strong>de</strong>red today as the largest oil spill in the<br />
history of petroleum industry. Data collected from several spatial instruments were used<br />
to analyse the extend of the oil spill, and evaluate its spreading evolution with respect<br />
to wind direction. The reflection of sun light off the ocean surface (sun glint) highlights