Th`ese Marouan BOUALI - Sites personnels de TELECOM ParisTech
Th`ese Marouan BOUALI - Sites personnels de TELECOM ParisTech
Th`ese Marouan BOUALI - Sites personnels de TELECOM ParisTech

Create successful ePaper yourself
Turn your PDF publications into a flip-book with our unique Google optimized e-Paper software.
52 3. Standard <strong>de</strong>striping techniques and application to MODIS<br />
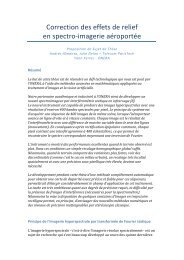
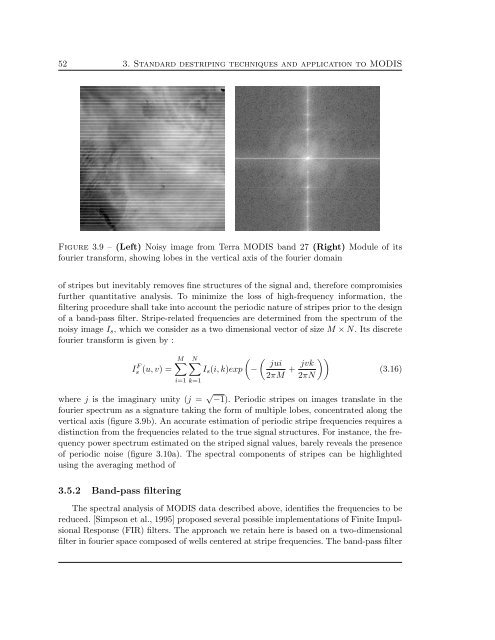
Figure 3.9 – (Left) Noisy image from Terra MODIS band 27 (Right) Module of its<br />
fourier transform, showing lobes in the vertical axis of the fourier domain<br />
of stripes but inevitably removes fine structures of the signal and, therefore compromisies<br />
further quantitative analysis. To minimize the loss of high-frequency information, the<br />
filtering procedure shall take into account the periodic nature of stripes prior to the <strong>de</strong>sign<br />
of a band-pass filter. Stripe-related frequencies are <strong>de</strong>termined from the spectrum of the<br />
noisy image I s , which we consi<strong>de</strong>r as a two dimensional vector of size M × N. Its discrete<br />
fourier transform is given by :<br />
I F s (u, v) =<br />
M∑<br />
N∑<br />
i=1 k=1<br />
( ( jui<br />
I s (i, k)exp −<br />
2πM + jvk ))<br />
2πN<br />
(3.16)<br />
where j is the imaginary unity (j = √ −1). Periodic stripes on images translate in the<br />
fourier spectrum as a signature taking the form of multiple lobes, concentrated along the<br />
vertical axis (figure 3.9b). An accurate estimation of periodic stripe frequencies requires a<br />
distinction from the frequencies related to the true signal structures. For instance, the frequency<br />
power spectrum estimated on the striped signal values, barely reveals the presence<br />
of periodic noise (figure 3.10a). The spectral components of stripes can be highlighted<br />
using the averaging method of<br />
3.5.2 Band-pass filtering<br />
The spectral analysis of MODIS data <strong>de</strong>scribed above, i<strong>de</strong>ntifies the frequencies to be<br />
reduced. [Simpson et al., 1995] proposed several possible implementations of Finite Impulsional<br />
Response (FIR) filters. The approach we retain here is based on a two-dimensional<br />
filter in fourier space composed of wells centered at stripe frequencies. The band-pass filter