Th`ese Marouan BOUALI - Sites personnels de TELECOM ParisTech
Th`ese Marouan BOUALI - Sites personnels de TELECOM ParisTech
Th`ese Marouan BOUALI - Sites personnels de TELECOM ParisTech
You also want an ePaper? Increase the reach of your titles
YUMPU automatically turns print PDFs into web optimized ePapers that Google loves.
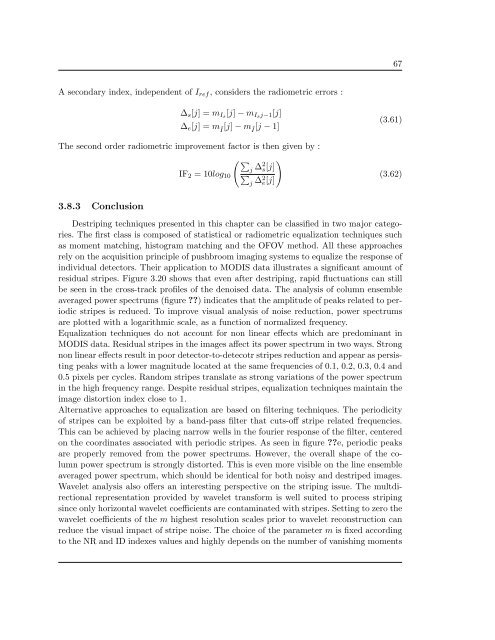
67<br />
A secondary in<strong>de</strong>x, in<strong>de</strong>pen<strong>de</strong>nt of I ref , consi<strong>de</strong>rs the radiometric errors :<br />
∆ s [j] =m Is [j] − m Isj−1[j]<br />
∆ e [j] =mÎ[j] − mÎ[j − 1]<br />
The second or<strong>de</strong>r radiometric improvement factor is then given by :<br />
(∑ )<br />
j<br />
IF 2 = 10log ∆2 s[j]<br />
10 ∑<br />
j ∆2 e[j]<br />
(3.61)<br />
(3.62)<br />
3.8.3 Conclusion<br />
Destriping techniques presented in this chapter can be classified in two major categories.<br />
The first class is composed of statistical or radiometric equalization techniques such<br />
as moment matching, histogram matching and the OFOV method. All these approaches<br />
rely on the acquisition principle of pushbroom imaging systems to equalize the response of<br />
individual <strong>de</strong>tectors. Their application to MODIS data illustrates a significant amount of<br />
residual stripes. Figure 3.20 shows that even after <strong>de</strong>striping, rapid fluctuations can still<br />
be seen in the cross-track profiles of the <strong>de</strong>noised data. The analysis of column ensemble<br />
averaged power spectrums (figure ) indicates that the amplitu<strong>de</strong> of peaks related to periodic<br />
stripes is reduced. To improve visual analysis of noise reduction, power spectrums<br />
are plotted with a logarithmic scale, as a function of normalized frequency.<br />
Equalization techniques do not account for non linear effects which are predominant in<br />
MODIS data. Residual stripes in the images affect its power spectrum in two ways. Strong<br />
non linear effects result in poor <strong>de</strong>tector-to-<strong>de</strong>tecotr stripes reduction and appear as persisting<br />
peaks with a lower magnitu<strong>de</strong> located at the same frequencies of 0.1, 0.2, 0.3, 0.4 and<br />
0.5 pixels per cycles. Random stripes translate as strong variations of the power spectrum<br />
in the high frequency range. Despite residual stripes, equalization techniques maintain the<br />
image distortion in<strong>de</strong>x close to 1.<br />
Alternative approaches to equalization are based on filtering techniques. The periodicity<br />
of stripes can be exploited by a band-pass filter that cuts-off stripe related frequencies.<br />
This can be achieved by placing narrow wells in the fourier response of the filter, centered<br />
on the coordinates associated with periodic stripes. As seen in figure e, periodic peaks<br />
are properly removed from the power spectrums. However, the overall shape of the column<br />
power spectrum is strongly distorted. This is even more visible on the line ensemble<br />
averaged power spectrum, which should be i<strong>de</strong>ntical for both noisy and <strong>de</strong>striped images.<br />
Wavelet analysis also offers an interesting perspective on the striping issue. The multdirectional<br />
representation provi<strong>de</strong>d by wavelet transform is well suited to process striping<br />
since only horizontal wavelet coefficients are contaminated with stripes. Setting to zero the<br />
wavelet coefficients of the m highest resolution scales prior to wavelet reconstruction can<br />
reduce the visual impact of stripe noise. The choice of the parameter m is fixed according<br />
to the NR and ID in<strong>de</strong>xes values and highly <strong>de</strong>pends on the number of vanishing moments


