Th`ese Marouan BOUALI - Sites personnels de TELECOM ParisTech
Th`ese Marouan BOUALI - Sites personnels de TELECOM ParisTech
Th`ese Marouan BOUALI - Sites personnels de TELECOM ParisTech

You also want an ePaper? Increase the reach of your titles
YUMPU automatically turns print PDFs into web optimized ePapers that Google loves.
53<br />
12<br />
11<br />
10<br />
10<br />
Power spectrum<br />
8<br />
6<br />
4<br />
2<br />
0<br />
Power spectrum<br />
9<br />
8<br />
7<br />
6<br />
5<br />
4<br />
−2<br />
0 0.1 0.2 0.3 0.4 0.5<br />
Normalized frequency<br />
3<br />
0 0.1 0.2 0.3 0.4 0.5<br />
Normalized frequency<br />
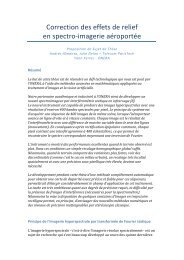
Figure 3.10 – (Left) Power spectrum computed directly on the noisy image, frequncies<br />
of striping are not visible (Right) Power spectrum computed as an average of the columns<br />
periodograms ; striping frequencies appear as distinct peaks<br />
1<br />
0.8<br />
0.6<br />
0.4<br />
0.2<br />
0<br />
1<br />
0.8<br />
0.6<br />
0.4<br />
0.2<br />
0<br />
u<br />
u<br />
v<br />
v<br />
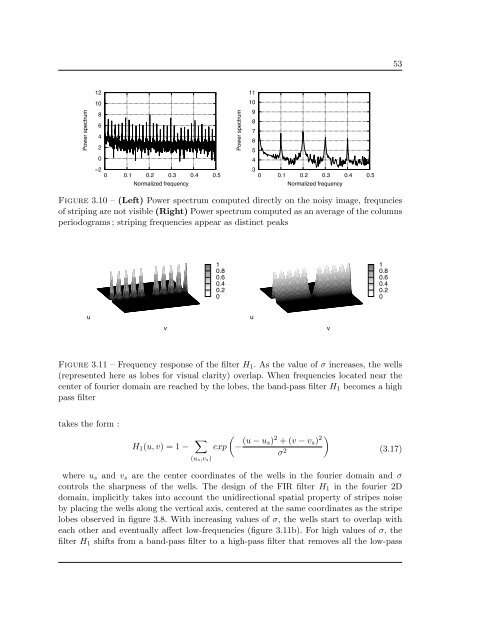
Figure 3.11 – Frequency response of the filter H 1 . As the value of σ increases, the wells<br />
(represented here as lobes for visual clarity) overlap. When frequencies located near the<br />
center of fourier domain are reached by the lobes, the band-pass filter H 1 becomes a high<br />
pass filter<br />
takes the form :<br />
H 1 (u, v) =1− ∑<br />
(u s,v s)<br />
exp<br />
(− (u − u s) 2 +(v − v s ) 2 )<br />
σ 2<br />
(3.17)<br />
where u s and v s are the center coordinates of the wells in the fourier domain and σ<br />
controls the sharpness of the wells. The <strong>de</strong>sign of the FIR filter H 1 in the fourier 2D<br />
domain, implicitly takes into account the unidirectional spatial property of stripes noise<br />
by placing the wells along the vertical axis, centered at the same coordinates as the stripe<br />
lobes observed in figure 3.8. With increasing values of σ, the wells start to overlap with<br />
each other and eventually affect low-frequencies (figure 3.11b). For high values of σ, the<br />
filter H 1 shifts from a band-pass filter to a high-pass filter that removes all the low-pass