Th`ese Marouan BOUALI - Sites personnels de TELECOM ParisTech
Th`ese Marouan BOUALI - Sites personnels de TELECOM ParisTech
Th`ese Marouan BOUALI - Sites personnels de TELECOM ParisTech

Create successful ePaper yourself
Turn your PDF publications into a flip-book with our unique Google optimized e-Paper software.
55<br />
Image distortion ID<br />
1<br />
0.98<br />
0.96<br />
0.94<br />
0.92<br />
0.9<br />
0.88<br />
0.86<br />
0.84<br />
0<br />
0 10 20 30 40 50<br />
σ<br />
ID<br />
NR<br />
2000<br />
1600<br />
1200<br />
800<br />
400<br />
Noise reduction NR<br />
Image distortion ID<br />
1<br />
0.98<br />
0.96<br />
0.94<br />
0.92<br />
0.9<br />
0.88<br />
0.86<br />
0.84<br />
ID<br />
NR<br />
30<br />
25<br />
20<br />
15<br />
10<br />
0<br />
0 10 20 30 40 50<br />
σ<br />
5<br />
Noise reduction NR<br />
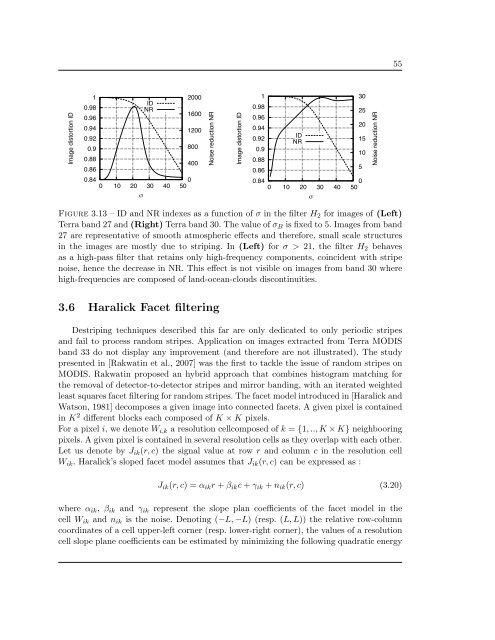
Figure 3.13 – ID and NR in<strong>de</strong>xes as a function of σ in the filter H 2 for images of (Left)<br />
Terra band 27 and (Right) Terra band 30. The value of σ B is fixed to 5. Images from band<br />
27 are representative of smooth atmospheric effects and therefore, small scale structures<br />
in the images are mostly due to striping. In (Left) for σ > 21, the filter H 2 behaves<br />
as a high-pass filter that retains only high-frequency components, coinci<strong>de</strong>nt with stripe<br />
noise, hence the <strong>de</strong>crease in NR. This effect is not visible on images from band 30 where<br />
high-frequencies are composed of land-ocean-clouds discontinuities.<br />
3.6 Haralick Facet filtering<br />
Destriping techniques <strong>de</strong>scribed this far are only <strong>de</strong>dicated to only periodic stripes<br />
and fail to process random stripes. Application on images extracted from Terra MODIS<br />
band 33 do not display any improvement (and therefore are not illustrated). The study<br />
presented in [Rakwatin et al., 2007] was the first to tackle the issue of random stripes on<br />
MODIS. Rakwatin proposed an hybrid approach that combines histogram matching for<br />
the removal of <strong>de</strong>tector-to-<strong>de</strong>tector stripes and mirror banding, with an iterated weighted<br />
least squares facet filtering for random stripes. The facet mo<strong>de</strong>l introduced in [Haralick and<br />
Watson, 1981] <strong>de</strong>composes a given image into connected facets. A given pixel is contained<br />
in K 2 different blocks each composed of K × K pixels.<br />
For a pixel i, we <strong>de</strong>note W i,k a resolution cellcomposed of k = {1, .., K × K} neighbooring<br />
pixels. A given pixel is contained in several resolution cells as they overlap with each other.<br />
Let us <strong>de</strong>note by J ik (r, c) the signal value at row r and column c in the resolution cell<br />
W ik . Haralick’s sloped facet mo<strong>de</strong>l assumes that J ik (r, c) can be expressed as :<br />
J ik (r, c) =α ik r + β ik c + γ ik + n ik (r, c) (3.20)<br />
where α ik , β ik and γ ik represent the slope plan coefficients of the facet mo<strong>de</strong>l in the<br />
cell W ik and n ik is the noise. Denoting (−L, −L) (resp. (L, L)) the relative row-column<br />
coordinates of a cell upper-left corner (resp. lower-right corner), the values of a resolution<br />
cell slope plane coefficients can be estimated by minimizing the following quadratic energy