Th`ese Marouan BOUALI - Sites personnels de TELECOM ParisTech
Th`ese Marouan BOUALI - Sites personnels de TELECOM ParisTech
Th`ese Marouan BOUALI - Sites personnels de TELECOM ParisTech
Create successful ePaper yourself
Turn your PDF publications into a flip-book with our unique Google optimized e-Paper software.
66 3. Standard <strong>de</strong>striping techniques and application to MODIS<br />
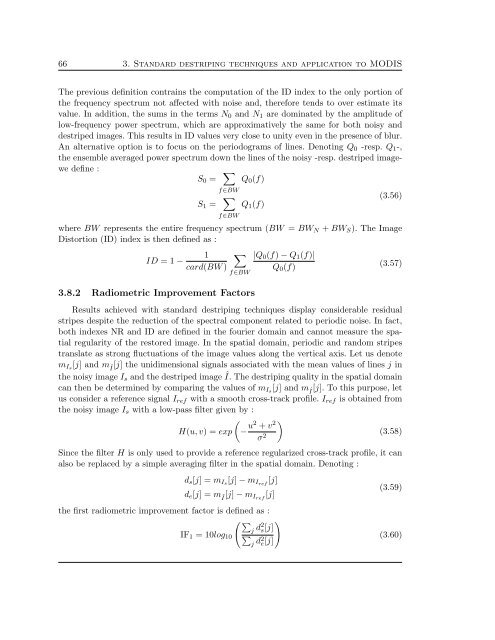
The previous <strong>de</strong>finition contrains the computation of the ID in<strong>de</strong>x to the only portion of<br />
the frequency spectrum not affected with noise and, therefore tends to over estimate its<br />
value. In addition, the sums in the terms N 0 and N 1 are dominated by the amplitu<strong>de</strong> of<br />
low-frequency power spectrum, which are approximatively the same for both noisy and<br />
<strong>de</strong>striped images. This results in ID values very close to unity even in the presence of blur.<br />
An alternative option is to focus on the periodograms of lines. Denoting Q 0 -resp. Q 1 -,<br />
the ensemble averaged power spectrum down the lines of the noisy -resp. <strong>de</strong>striped imagewe<br />
<strong>de</strong>fine :<br />
S 0 =<br />
∑<br />
Q 0 (f)<br />
S 1 =<br />
f∈BW<br />
∑<br />
f∈BW<br />
Q 1 (f)<br />
(3.56)<br />
where BW represents the entire frequency spectrum (BW = BW N + BW S ). The Image<br />
Distortion (ID) in<strong>de</strong>x is then <strong>de</strong>fined as :<br />
ID =1−<br />
1<br />
card(BW)<br />
∑<br />
f∈BW<br />
3.8.2 Radiometric Improvement Factors<br />
|Q 0 (f) − Q 1 (f)|<br />
Q 0 (f)<br />
(3.57)<br />
Results achieved with standard <strong>de</strong>striping techniques display consi<strong>de</strong>rable residual<br />
stripes <strong>de</strong>spite the reduction of the spectral component related to periodic noise. In fact,<br />
both in<strong>de</strong>xes NR and ID are <strong>de</strong>fined in the fourier domain and cannot measure the spatial<br />
regularity of the restored image. In the spatial domain, periodic and random stripes<br />
translate as strong fluctuations of the image values along the vertical axis. Let us <strong>de</strong>note<br />
m Is [j] and mÎ[j] the unidimensional signals associated with the mean values of lines j in<br />
the noisy image I s and the <strong>de</strong>striped image Î. The <strong>de</strong>striping quality in the spatial domain<br />
can then be <strong>de</strong>termined by comparing the values of m Is [j] and mÎ[j]. To this purpose, let<br />
us consi<strong>de</strong>r a reference signal I ref with a smooth cross-track profile. I ref is obtained from<br />
the noisy image I s with a low-pass filter given by :<br />
H(u, v) =exp<br />
(− u2 + v 2 )<br />
σ 2 (3.58)<br />
Since the filter H is only used to provi<strong>de</strong> a reference regularized cross-track profile, it can<br />
also be replaced by a simple averaging filter in the spatial domain. Denoting :<br />
d s [j] =m Is [j] − m Iref [j]<br />
d e [j] =mÎ[j] − m Iref [j]<br />
the first radiometric improvement factor is <strong>de</strong>fined as :<br />
(∑ )<br />
j<br />
IF 1 = 10log d2 s[j]<br />
10 ∑<br />
j d2 e[j]<br />
(3.59)<br />
(3.60)


