Annual and Sustainability Report 2011 - Teracom
Annual and Sustainability Report 2011 - Teracom
Annual and Sustainability Report 2011 - Teracom

Create successful ePaper yourself
Turn your PDF publications into a flip-book with our unique Google optimized e-Paper software.
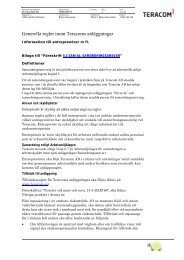
The Group's breakdown of<br />
climate impact<br />
Electricity <strong>and</strong><br />
district heating 78%<br />
Fuel 11%<br />
Business trips 4%<br />
Commuting 3%<br />
Premises 2%<br />
Freight transports 1%<br />
Fuel production <strong>and</strong><br />
shipment 1%<br />
• Improvement of travel patterns, including better opportunities for video<br />
conferences<br />
• More stringent environmental <strong>and</strong> energy requirements when making<br />
purchases<br />
Energy consumption <strong>and</strong> environmental impact<br />
The <strong>Teracom</strong> Group's largest impact on the environment is from fuel <strong>and</strong> energy<br />
consumption, which also directly impacts the Group’s operating costs.<br />
In order to decrease the Group's fuel <strong>and</strong> energy consumption, a number of<br />
initiatives have been implemented to streamline its energy use. Data on direct<br />
<strong>and</strong> indirect energy consumption has also been compiled <strong>and</strong> converted into CO 2<br />
equivalents. In <strong>2011</strong>, data on <strong>Teracom</strong> Denmark’s consumption was also identified<br />
<strong>and</strong> converted into CO 2<br />
equivalents in order to quantify the Group’s carbon<br />
footprint. This work has been used to set goals <strong>and</strong> form action plans that will<br />
reduce the environmental impact.<br />
EN3<br />
The Group's fuel consumption<br />
The Group's direct energy consumption is the fuel consumed by the various<br />
combustion engines owned or leased by its companies. In <strong>2011</strong>, fuel consumption<br />
increased due to an increase in the service business. For example, the Group's<br />
direct energy consumption comes from its use of:<br />
• Company cars (business use <strong>and</strong>/or private use), snowmobiles, four-wheelers,<br />
all-terrain vehicles, etc., that are fueled by diesel, gasoline or ethanol.<br />
• Mast elevators <strong>and</strong> mobile power stations that are fuelled by gasoline.<br />
• Backup power stations fuelled by diesel.<br />
facts<br />
Greenhouse effect<br />
Heating of the surface of the earth caused by<br />
the earth’s atmosphere. The effect is due to<br />
part of the thermal radiation from the earth's<br />
surface being re-radiated back to the earth<br />
after being absorbed by the atmosphere.<br />
CO 2<br />
equivalents<br />
A common unit of measure that makes it<br />
possible to compare the climate impact of<br />
various greenhouse gases, their converted<br />
greenhouse effect expressed in the equivalent<br />
amount of carbon emissions.<br />
CO 2<br />
emission<br />
EN4<br />
Emissions of carbon dioxide or converted<br />
equivalents.<br />
Electricity consumption of network companies<br />
Operating a nationwide terrestrial network for TV broadcast consumes a great deal<br />
of electricity. The <strong>Teracom</strong> Group has offices <strong>and</strong> stations that use energy, specifically<br />
electricity, heat <strong>and</strong> cooling. In <strong>2011</strong> energy consumption for the Group was<br />
about 139 GWh. The GRI index presents the Group’s total consumption of electricity<br />
<strong>and</strong> heat purchased directly from producers as well as the energy consumption<br />
of premises using indicator EN4 (energy consumption for premises was<br />
reported in 2010 in indicator EN17).<br />
The Group's indirect energy consumption comes from its use of electricity,<br />
district cooling <strong>and</strong> district heating. The network companies’ services (broadcasting)<br />
<strong>and</strong> operation of stations in Sweden <strong>and</strong> Denmark account for 98 percent of<br />
energy consumption.<br />
The production mix for electricity in the Danish operation consists of 27<br />
percent renewable energy sources (biomass/biogas <strong>and</strong> wind/water <strong>and</strong> solar<br />
energy) <strong>and</strong> 73 percent non-renewable energy sources (mainly coal) <strong>and</strong> explains<br />
the large increase (four times greater than 2010) in the Group's emissions.<br />
About 99 percent of <strong>Teracom</strong> Sweden’s energy consumption is electricity<br />
purchased from an electricity supplier where the primary energy sources consist of<br />
53 percent renewable energy <strong>and</strong> 47 percent non-renewable energy sources. The<br />
renewable sources are primarily water power <strong>and</strong>, to a smaller extent, wind power.<br />
The non-renewable sources consist almost exclusively of nuclear power. Electricity<br />
subscriptions in the two countries have a variable production mix from year to<br />
year, which means that emissions for the <strong>Teracom</strong> Group change in the same way.<br />
An electricity loss of about 3 to 9 percent occurs during transmission from power<br />
plant to <strong>Teracom</strong> Sweden's facilities.<br />
32