RACE AND THE ENFORCEMENT OF DRUG DELIVERY LAWS IN ...
RACE AND THE ENFORCEMENT OF DRUG DELIVERY LAWS IN ...
RACE AND THE ENFORCEMENT OF DRUG DELIVERY LAWS IN ...

Create successful ePaper yourself
Turn your PDF publications into a flip-book with our unique Google optimized e-Paper software.
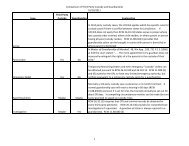
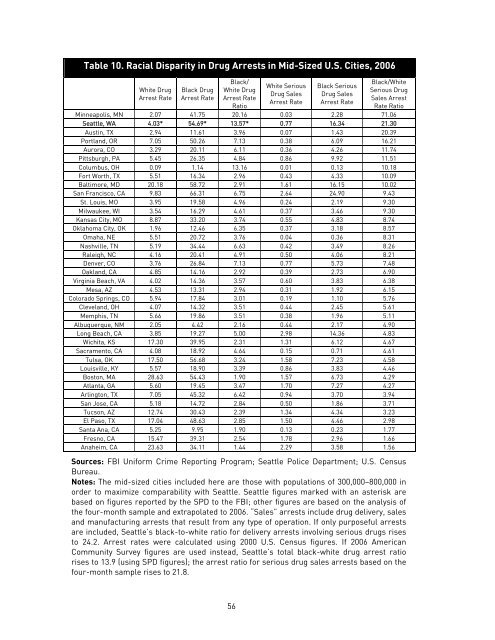
Table 10. Racial Disparity in Drug Arrests in Mid-Sized U.S. Cities, 2006<br />
White Drug<br />
Arrest Rate<br />
Black Drug<br />
Arrest Rate<br />
Black/<br />
White Drug<br />
Arrest Rate<br />
Ratio<br />
White Serious<br />
Drug Sales<br />
Arrest Rate<br />
Black Serious<br />
Drug Sales<br />
Arrest Rate<br />
Black/White<br />
Serious Drug<br />
Sales Arrest<br />
Rate Ratio<br />
Minneapolis, MN 2.07 41.75 20.16 0.03 2.28 71.06<br />
Seattle, WA 4.03* 54.69* 13.57* 0.77 16.34 21.30<br />
Austin, TX 2.94 11.61 3.96 0.07 1.43 20.39<br />
Portland, OR 7.05 50.26 7.13 0.38 6.09 16.21<br />
Aurora, CO 3.29 20.11 6.11 0.36 4.26 11.74<br />
Pittsburgh, PA 5.45 26.35 4.84 0.86 9.92 11.51<br />
Columbus, OH 0.09 1.14 13.16 0.01 0.13 10.18<br />
Fort Worth, TX 5.51 16.34 2.96 0.43 4.33 10.09<br />
Baltimore, MD 20.18 58.72 2.91 1.61 16.15 10.02<br />
San Francisco, CA 9.83 66.31 6.75 2.64 24.90 9.43<br />
St. Louis, MO 3.95 19.58 4.96 0.24 2.19 9.30<br />
Milwaukee, WI 3.54 16.29 4.61 0.37 3.46 9.30<br />
Kansas City, MO 8.87 33.20 3.74 0.55 4.83 8.74<br />
Oklahoma City, OK 1.96 12.46 6.35 0.37 3.18 8.57<br />
Omaha, NE 5.51 20.72 3.76 0.04 0.36 8.31<br />
Nashville, TN 5.19 34.44 6.63 0.42 3.49 8.26<br />
Raleigh, NC 4.16 20.41 4.91 0.50 4.06 8.21<br />
Denver, CO 3.76 26.84 7.13 0.77 5.73 7.48<br />
Oakland, CA 4.85 14.16 2.92 0.39 2.73 6.90<br />
Virginia Beach, VA 4.02 14.36 3.57 0.60 3.83 6.38<br />
Mesa, AZ 4.53 13.31 2.94 0.31 1.92 6.15<br />
Colorado Springs, CO 5.94 17.84 3.01 0.19 1.10 5.76<br />
Cleveland, OH 4.07 14.32 3.51 0.44 2.45 5.61<br />
Memphis, TN 5.66 19.86 3.51 0.38 1.96 5.11<br />
Albuquerque, NM 2.05 4.42 2.16 0.44 2.17 4.90<br />
Long Beach, CA 3.85 19.27 5.00 2.98 14.36 4.83<br />
Wichita, KS 17.30 39.95 2.31 1.31 6.12 4.67<br />
Sacramento, CA 4.08 18.92 4.64 0.15 0.71 4.61<br />
Tulsa, OK 17.50 56.68 3.24 1.58 7.23 4.58<br />
Louisville, KY 5.57 18.90 3.39 0.86 3.83 4.46<br />
Boston, MA 28.63 54.43 1.90 1.57 6.73 4.29<br />
Atlanta, GA 5.60 19.45 3.47 1.70 7.27 4.27<br />
Arlington, TX 7.05 45.32 6.42 0.94 3.70 3.94<br />
San Jose, CA 5.18 14.72 2.84 0.50 1.86 3.71<br />
Tucson, AZ 12.74 30.43 2.39 1.34 4.34 3.23<br />
El Paso, TX 17.04 48.63 2.85 1.50 4.46 2.98<br />
Santa Ana, CA 5.25 9.95 1.90 0.13 0.23 1.77<br />
Fresno, CA 15.47 39.31 2.54 1.78 2.96 1.66<br />
Anaheim, CA 23.63 34.11 1.44 2.29 3.58 1.56<br />
Sources: FBI Uniform Crime Reporting Program; Seattle Police Department; U.S. Census<br />
Bureau.<br />
Notes: The mid-sized cities included here are those with populations of 300,000–800,000 in<br />
order to maximize comparability with Seattle. Seattle figures marked with an asterisk are<br />
based on figures reported by the SPD to the FBI; other figures are based on the analysis of<br />
the four-month sample and extrapolated to 2006. “Sales” arrests include drug delivery, sales<br />
and manufacturing arrests that result from any type of operation. If only purposeful arrests<br />
are included, Seattle’s black-to-white ratio for delivery arrests involving serious drugs rises<br />
to 24.2. Arrest rates were calculated using 2000 U.S. Census figures. If 2006 American<br />
Community Survey figures are used instead, Seattle’s total black-white drug arrest ratio<br />
rises to 13.9 (using SPD figures); the arrest ratio for serious drug sales arrests based on the<br />
four-month sample rises to 21.8.<br />
56