You also want an ePaper? Increase the reach of your titles
YUMPU automatically turns print PDFs into web optimized ePapers that Google loves.
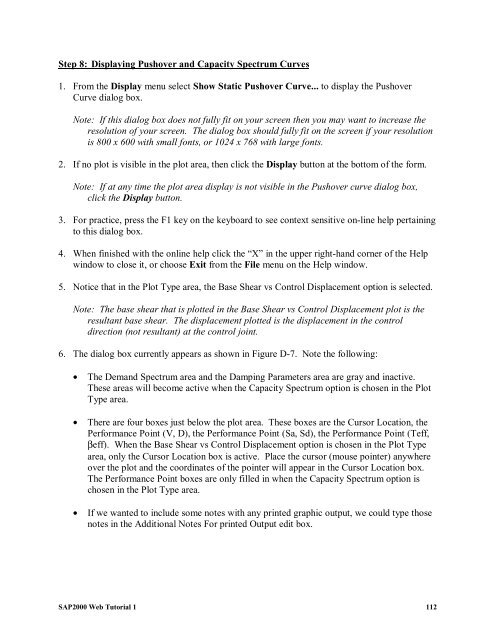
Step 8: Displaying Pushover and Capacity Spectrum Curves<br />
1. From the Display menu select Show Static Pushover Curve... to display the Pushover<br />
Curve dialog box.<br />
Note: If this dialog box does not fully fit on your screen then you may want to increase the<br />
resolution of your screen. The dialog box should fully fit on the screen if your resolution<br />
is 800 x 600 with small fonts, or 1024 x 768 with large fonts.<br />
2. If no plot is visible in the plot area, then click the Display button at the bottom of the form.<br />
Note: If at any time the plot area display is not visible in the Pushover curve dialog box,<br />
click the Display button.<br />
3. For practice, press the F1 key on the keyboard to see context sensitive on-line help pertaining<br />
to this dialog box.<br />
4. When finished with the online help click the “X” in the upper right-hand corner of the Help<br />
window to close it, or choose Exit from the File menu on the Help window.<br />
5. Notice that in the Plot Type area, the Base Shear vs Control Displacement option is selected.<br />
Note: The base shear that is plotted in the Base Shear vs Control Displacement plot is the<br />
resultant base shear. The displacement plotted is the displacement in the control<br />
direction (not resultant) at the control joint.<br />
6. The dialog box currently appears as shown in Figure D-7. Note the following:<br />
• The Demand Spectrum area and the Damping Parameters area are gray and inactive.<br />
These areas will become active when the Capacity Spectrum option is chosen in the Plot<br />
Type area.<br />
• There are four boxes just below the plot area. These boxes are the Cursor Location, the<br />
Performance Point (V, D), the Performance Point (Sa, Sd), the Performance Point (Teff,<br />
βeff). When the Base Shear vs Control Displacement option is chosen in the Plot Type<br />
area, only the Cursor Location box is active. Place the cursor (mouse pointer) anywhere<br />
over the plot and the coordinates of the pointer will appear in the Cursor Location box.<br />
The Performance Point boxes are only filled in when the Capacity Spectrum option is<br />
chosen in the Plot Type area.<br />
• If we wanted to include some notes with any printed graphic output, we could type those<br />
notes in the Additional Notes For printed Output edit box.<br />
<strong>SAP2000</strong> <strong>Web</strong> <strong>Tutorial</strong> 1 112


