- Page 1 and 2:
PLENTIFUL ENERGY The Story of the I
- Page 3 and 4:
Copyright © 2011 Charles E. Till a
- Page 6 and 7:
CONTENTS FOREWORD .................
- Page 8 and 9:
CHAPTER 10 APPLICATION OF PYROPROCE
- Page 10 and 11:
FOREWORD On a breezy December day i
- Page 12 and 13:
CHAPTER 1 ARGONNE NATIONAL LABORATO
- Page 14 and 15:
even now is straining the limits of
- Page 16 and 17:
with events and time. Till saw the
- Page 18 and 19:
it, I saw how a national laboratory
- Page 20 and 21:
Figure 1-2. West stands of the Stag
- Page 22 and 23:
development of nuclear power for ci
- Page 24 and 25:
depended on U.S. ability to maintai
- Page 26 and 27:
construction funding kept increasin
- Page 28 and 29:
faced a nightmarish combination of
- Page 30 and 31:
concept in the next decade.) In sti
- Page 32 and 33:
was based on EBR-I experience, but
- Page 34 and 35:
Figure 1-9. Experimental Breeder Re
- Page 36 and 37:
Figure 1-11. Rendering of the EBR-I
- Page 38 and 39:
performance. But the decision had b
- Page 40 and 41:
its shakedown in early years it jus
- Page 42 and 43:
sense primarily a commercial power
- Page 44 and 45:
without electrical generation, the
- Page 46 and 47:
Its purpose was to demonstrate the
- Page 48 and 49:
of each period, which the managemen
- Page 50 and 51:
CHAPTER 2 THE INTEGRAL FAST REACTOR
- Page 52 and 53:
A line had been pursued that the re
- Page 54 and 55:
The IFR refining process also produ
- Page 56 and 57:
director of Argonne a year or two b
- Page 58 and 59:
eporting on nuclear power developme
- Page 60 and 61:
A few weeks later, the mid-term ele
- Page 62 and 63:
2.6 Summary In late 1983, the line
- Page 64 and 65:
Argonne would be. My Ph.D. at Imper
- Page 66 and 67:
I had worked at the United Kingdom
- Page 68 and 69:
hadn‘t bothered us with it. But t
- Page 70 and 71:
But I had gone over and over the on
- Page 72 and 73:
laboratories.‖ Incidentally, late
- Page 74 and 75:
Argonne by this time was one of sev
- Page 76 and 77:
3.1.2 Life at the Laboratory in the
- Page 78 and 79:
An anecdote: In the cooperative arr
- Page 80 and 81:
Cycle Facility‖ went. We pushed i
- Page 82 and 83:
(LMFBR), which assumed a very rapid
- Page 84 and 85:
the pool was a settled issue; it wa
- Page 86 and 87:
During the early stage of the IFR p
- Page 88 and 89:
scientific work, not on non-essenti
- Page 90 and 91:
e generally held, even as facts inc
- Page 92 and 93:
cf per day from Canada via pipeline
- Page 94 and 95:
serious, and it is made more seriou
- Page 96 and 97:
global economy. The LWR, and the Ad
- Page 98 and 99:
supply 11%, and one, the world‘s
- Page 100 and 101:
Fatih Birol, has recently been quot
- Page 102 and 103:
gas production of little use in the
- Page 104 and 105:
expenditures during a decade starti
- Page 106 and 107:
thousand tonnes in one large increm
- Page 108 and 109:
But the principal line of developme
- Page 110 and 111:
Tar sands and oil shale recovery ar
- Page 112 and 113:
14. W. H. Ziegler, C. J. Campbell,
- Page 114 and 115:
Argonne had been a part of the deve
- Page 116 and 117:
Breaches or holes in the fuel cladd
- Page 118 and 119:
waste. For efficiency in uranium us
- Page 120 and 121:
Further, as a metal, sodium does no
- Page 122 and 123:
to the boundaries and many leak fro
- Page 124 and 125:
is debatable, it remains our belief
- Page 126 and 127:
CHAPTER 6 IFR FUEL CHARACTERISTICS,
- Page 128 and 129:
To do this, an extraordinarily simp
- Page 130 and 131:
Further cementing the decision was
- Page 132 and 133:
the AEC, but the reactor operation
- Page 134 and 135:
hands-on access needed to accomplis
- Page 136 and 137:
temperature. However, a very substa
- Page 138 and 139:
It turned out that the high-plutoni
- Page 140 and 141:
In the column ―Pu content % heavy
- Page 142 and 143:
40 start-ups and shutdowns 5 15% ov
- Page 144 and 145:
During casting, a partial vacuum (1
- Page 146 and 147:
is in fact a new fuel. Plutonium-ba
- Page 148 and 149:
8. G. L. Hofman and L. C. Walters,
- Page 150 and 151:
characteristics necessary for this.
- Page 152 and 153:
exchangers, and the steam generator
- Page 154 and 155:
experiments, as mentioned; this has
- Page 156 and 157:
sufficient to allow radioactive rel
- Page 158 and 159:
In the IFR, this loss of the coolin
- Page 160 and 161:
Figure7- 2. Reactor outlet temperat
- Page 162 and 163:
for thermal expansion of heavy stru
- Page 164 and 165:
power to shut down power is basical
- Page 166 and 167:
criticality. The debris is in the f
- Page 168 and 169:
7.10.2 The EBR-I Partial Meltdown T
- Page 170 and 171:
7.11 Licensing Implications What ar
- Page 172 and 173:
The sodium flowing into the steam g
- Page 174 and 175:
[15] Provisions are also made to co
- Page 176 and 177:
disassembly comes, it is with a rea
- Page 178 and 179:
CHAPTER 8 THE PYROPROCESS In the ne
- Page 180 and 181:
EBR-II purposes, and it established
- Page 182 and 183:
valuable fuel constituents, uranium
- Page 184 and 185:
and materials and it had been renam
- Page 186 and 187:
The first operation is done in the
- Page 188 and 189:
into the receiver crucible. The hea
- Page 190 and 191:
In the final step, the pins are arr
- Page 192 and 193:
Spent Fuel Processed, kg effective
- Page 194 and 195:
products, highly radioactive and se
- Page 196 and 197:
its own bayonet-style partial inter
- Page 198 and 199:
If the bond sodium along with the s
- Page 200 and 201:
CHAPTER 9 THE BASIS OF THE ELECTROR
- Page 202 and 203:
Whether or not a given reaction can
- Page 204 and 205:
9.3 Kinetics of the Reactions Chemi
- Page 206 and 207:
The exponential exp((E f -E b )/RT)
- Page 208 and 209:
The electrorefining process brings
- Page 210 and 211:
cathode operation. Once the solutio
- Page 212 and 213:
Table 9-2. Measured data and calcul
- Page 214 and 215:
All four measurements show that eve
- Page 216 and 217:
The free energy of the reaction of
- Page 218 and 219:
2. At an actinide chloride ratio of
- Page 220 and 221:
CHAPTER 10 APPLICATION OF PYROPROCE
- Page 222 and 223:
10.2 Electrolytic Reduction Step 10
- Page 224 and 225:
The pyrochemical process simply sup
- Page 226 and 227:
Figure 10-1. Electrolytic reduction
- Page 228 and 229:
The distribution of fuel constituen
- Page 230 and 231:
an electrorefiner with a 5001,000 k
- Page 232 and 233:
aqueous reprocessing plant. The eco
- Page 234 and 235:
Li metal at the cathode. Lithium me
- Page 236 and 237:
4. D. W. Dees and J. P. Ackerman,
- Page 238 and 239:
Our intent for the IFR technology w
- Page 240 and 241:
dose to any member of the public mu
- Page 242 and 243:
IFR process, as we shall see, does
- Page 244 and 245:
Relative Radiological Toxicity uran
- Page 246 and 247:
doses from Tc-99 and I-129 equilibr
- Page 248 and 249:
Fraction of Initial Actinide, % pro
- Page 250 and 251:
long-lived fission products and tra
- Page 252 and 253:
to decay to the point where they co
- Page 254 and 255:
References 1. ―Nuclear Waste Poli
- Page 256 and 257:
12.1 Introduction Assessment of a p
- Page 258 and 259:
History provides empirical evidence
- Page 260 and 261:
program offered nations help with n
- Page 262 and 263:
Other nations are recycling their s
- Page 264 and 265:
uranium-233 cycle has been half-hea
- Page 266 and 267:
electrorefiner salt. And this, of c
- Page 268 and 269:
those concentrations in making the
- Page 270 and 271:
chance of ―pre-ignition‖ leadin
- Page 272 and 273:
It is now known that the plutonium
- Page 274 and 275:
12.8 Monitoring of Processes Always
- Page 276 and 277:
[18] In it he shows that with a spo
- Page 278 and 279:
Such a system tracks the quantity a
- Page 280 and 281:
weapons grade plutonium. Levels of
- Page 282 and 283:
12.13 Summary In IFR technology the
- Page 284 and 285:
12. T. P. McLaughlin, et al., ―A
- Page 286 and 287:
The earliest fast reactors designed
- Page 288 and 289:
India, too, has successfully operat
- Page 290 and 291:
levels, actually higher than the di
- Page 292 and 293:
for the backend of the fuel cycle,
- Page 294 and 295:
$/lb Uranium Price, $/lb U3O8 the f
- Page 296 and 297:
the once-through fuel cycle. Howeve
- Page 298 and 299:
$/kg 1200 1000 $1000/kg Rep Cost Pu
- Page 300 and 301:
Table 13-7. Summary Comparison of F
- Page 302 and 303:
fabrication. This, along with a low
- Page 304 and 305:
Fissile Cost, $/gm-fissile Fuel Cyc
- Page 306 and 307:
13.6 System Aspects The previous se
- Page 308 and 309:
waste streams have no long-term dec
- Page 310 and 311:
5. S. C. Chetal, ―India‘s Fast
- Page 312 and 313:
capacity over this century, in a sy
- Page 314 and 315:
thermal properties of NaK—the boi
- Page 316 and 317:
It is suspected that the lead corro
- Page 318 and 319:
Neutron Yield, Eta Value A = number
- Page 320 and 321:
to maintain a hard spectrum, the fu
- Page 322 and 323:
Table 14-3. Effects of fuel pin dia
- Page 324 and 325:
Fuel Volume Fraction have a large e
- Page 326 and 327:
neutron leakages from the core are
- Page 328 and 329:
like breeding, does increase such d
- Page 330 and 331:
substantial advantage to start with
- Page 332 and 333:
Doubling Time, yrs the reactivity c
- Page 334 and 335:
14.7 Worldwide Fast Reactor Experie
- Page 336 and 337:
limit to its life. The ingenuity of
- Page 338 and 339:
Nuclear Capacity, GWe the replaceme
- Page 340 and 341:
14.9 How to Deploy Pyroprocessing P
- Page 342 and 343:
construction projects. They may see
- Page 344 and 345: inferior to sodium in their thermal
- Page 346: 5. Federation of American Scientist
- Page 349 and 350: Supporting the reactor design and c
- Page 352 and 353: ACKNOWLEDGEMENTS In beginning this
- Page 354 and 355: APPENDIX A DETAILED EXPLANATION OF
- Page 356 and 357: The actinide metals (uranium, pluto
- Page 358 and 359: As noted above, the interactions ri
- Page 360 and 361: 3. Equilibrium coefficients give th
- Page 362 and 363: ion is created at the anode. Bulk t
- Page 364 and 365: proceed spontaneously. If the magni
- Page 366 and 367: product chlorides are highly stable
- Page 368 and 369: increases with increasing temperatu
- Page 370 and 371: Equilibrium in a chemical system is
- Page 372 and 373: Exp(-ΔG o /RT) = [ U / Pu ] [ U /
- Page 374 and 375: ―in solution.‖ More Pu added to
- Page 376 and 377: appropriate values are used for the
- Page 378 and 379: A.9.5 The Second Cathode Regime: On
- Page 380 and 381: in the real world. Uranium dendrite
- Page 382 and 383: This is the significant number. The
- Page 384 and 385: For those who are curious, the elec
- Page 386 and 387: of concentration of uranium chlorid
- Page 388 and 389: agreement with the measured ratio w
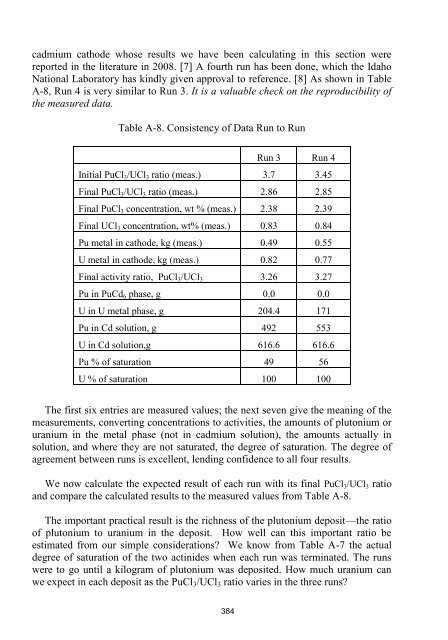
- Page 390 and 391: eference 7. The important calculati
- Page 392 and 393: as well. The numbers were obtained
- Page 396 and 397: The final actinide chloride ratios
- Page 398: values of several of the constants
- Page 401 and 402: HCDA HFEF HM HWR HTR IAEA ICRP IEA
- Page 404: ABOUT THE AUTHORS Dr. CHARLES E. TI