Looking Glass River Watershed Management Plan - Greater ...
Looking Glass River Watershed Management Plan - Greater ...
Looking Glass River Watershed Management Plan - Greater ...

You also want an ePaper? Increase the reach of your titles
YUMPU automatically turns print PDFs into web optimized ePapers that Google loves.
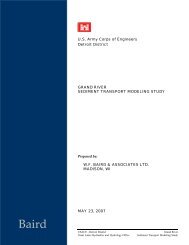
Figure 2-9 provides a summary of USGS stream gauging data from 1944 to<br />
2003 for station 04114498 - <strong>Looking</strong> <strong>Glass</strong> <strong>River</strong> at the Tallman Road bridge<br />
near Eagle, Michigan (USGS, 2005). The presented information is the<br />
monthly mean streamflows in cubic feet per second (cfs). The vertical bar<br />
above each month illustrates the range of flow recorded and the horizontal<br />
tick mark on each vertical bar is the monthly mean stream flow. Stream flow<br />
has varied from a low of 14 cfs in July 1965 to a high of 1131 cfs in April 1947.<br />
Figure 2-9 Stream Flow Data at Eagle, MI<br />
1200<br />
1000<br />
800<br />
Flow (cfs)<br />
600<br />
400<br />
200<br />
0<br />
Jan Feb Mar Apr May Jun Jul Aug Sep Oct Nov Dec<br />
Month<br />
Point Sources of Potential Pollutants<br />
Within the watershed, there are five facilities that are permitted to discharge<br />
certain pollutants. These include the SCCUMA Waste Water Treatment<br />
<strong>Plan</strong>t (WWTP) in DeWitt Township and four other sites (three in Watertown<br />
Township, one in DeWitt Township). These are identified in Figure 2-10.<br />
Source: ATSDR, 2005.<br />
Source: SCCMUA, 2005.<br />
Section 2: <strong>Watershed</strong> Characteristics 2-11