Looking Glass River Watershed Management Plan - Greater ...
Looking Glass River Watershed Management Plan - Greater ...
Looking Glass River Watershed Management Plan - Greater ...

You also want an ePaper? Increase the reach of your titles
YUMPU automatically turns print PDFs into web optimized ePapers that Google loves.
which is used in hydrology computations. Some flow conveyance<br />
information is available from the respective County Drain Commissioner’s<br />
offices, the MDEQ and as well as from some municipalities.<br />
Information on indicators is available in the form of organism biodiversity<br />
and population data, and physical characteristics as observed from the<br />
various inventory and screening efforts are all discussed in Section 3.<br />
Load Estimates<br />
Load estimates for altered hydrology are not specifically available rather<br />
surrogate estimates are used, namely the stream flow variations, flashiness<br />
indices and the amount of imperviousness within the watershed.<br />
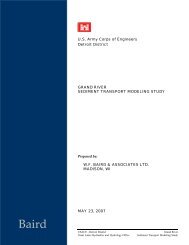
Average annual stream flow statistics (annual minimums, maximums and<br />
average annual flows) are provided in Figure 5-1. This data shows that the<br />
<strong>Looking</strong> <strong>Glass</strong> <strong>River</strong> experienced much higher peak flows during the period<br />
of record than it has in the last 10 years. What is not evident in this<br />
information is the cause of the maximum flows, i.e. the combination of land<br />
use, conveyance pathways and precipitation. A detailed historical flow<br />
characterization of the <strong>Looking</strong> <strong>Glass</strong> <strong>River</strong> is beyond the scope of this<br />
watershed management plan.<br />
Figure 5-1 Stream Flow at Eagle (USGS 04114498)<br />
1200<br />
1000<br />
Streamflow (cfs)<br />
800<br />
600<br />
400<br />
200<br />
0<br />
1944<br />
1949<br />
1954<br />
1959<br />
1964<br />
1969<br />
1974<br />
1979<br />
1984<br />
1989<br />
1994<br />
1999<br />
2004<br />
The term “flashy” as applied to stream flow has no set definition and in<br />
general flashy streams have rapid rates of change and stable streams have<br />
slow rates of change. The Richards-Baker Flashiness Index (abbreviated R-B<br />
Index) was calculated for the available stream flow data (Baker 2004). The R-<br />
B Index measures oscillations in flow relative to the total flow.<br />
The calculated R-B Index has varied over time with an average value of 0.10<br />
based on the USGS gauging station data, refer to Figure 5-2. According to<br />
the paper on the R-B index (Baker, 2004) an index value of 0.10 for these size<br />
watersheds is in the lowest quartile of flashiness when compared to the data<br />
from other sites. It should be noted that in the Baker study the flashier<br />
streams were outside of Michigan. For comparison purposes one of the most<br />
stable streams in Michigan is the Au Sable <strong>River</strong> which has an R-B Index of<br />
0.043 computed on the South Branch near Luzern.<br />
Another way to look at the R-B Index is to consider the trend over time.<br />
Based on the graph the <strong>Looking</strong> <strong>Glass</strong> <strong>River</strong> appears relatively stable over<br />
the last 50 years.<br />
Section 5: Stressor Summary 5-11