Looking Glass River Watershed Management Plan - Greater ...
Looking Glass River Watershed Management Plan - Greater ...
Looking Glass River Watershed Management Plan - Greater ...

You also want an ePaper? Increase the reach of your titles
YUMPU automatically turns print PDFs into web optimized ePapers that Google loves.
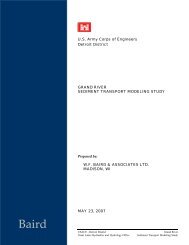
Figure 5-2 R-B Index at Eagle (USGS 04114498)<br />
0.2<br />
0.15<br />
R-B Index<br />
0.1<br />
0.05<br />
0<br />
1944 1954 1964 1974 1984 1994 2004<br />
An illustration of the watershed depicting the estimated percent<br />
imperviousness is provided in Figure 5-3. Tabulated in Table 5-4 is a<br />
summary of the percent imperviousness by subwatershed. For the purposes<br />
of these computations open water such as rivers, lakes and streams were<br />
assumed to have zero impervious area. As indicated in the Relevance of<br />
Impervious Cover section (Section 3), watersheds with an impervious cover<br />
less than 10 percent are considered sensitive, watersheds between 10 and 25<br />
percent are considered impacted, between 25 and 60 percent the watershed is<br />
considered non-supporting and greater than 60 percent the watershed is<br />
effectively just urban-drainage (Schueler, 1994). A watershed wide average<br />
percent impervious for the <strong>Looking</strong> <strong>Glass</strong> <strong>River</strong> watershed was computed to<br />
be 9.2 percent which places the watershed in the sensitive category.<br />
However when considering smaller units within the watershed impacted,<br />
non-supporting and urban drainage categories are identified. Table 5-4 also<br />
shows the percentage of area within each subwatershed in each of the four<br />
categories. Refer to Figure 2-1 for reference to the subwatershed locations.<br />
5-12 <strong>Looking</strong> <strong>Glass</strong> <strong>River</strong> <strong>Watershed</strong> April 2007