Economic crime report 2004 - Ekobrottsmyndigheten
Economic crime report 2004 - Ekobrottsmyndigheten
Economic crime report 2004 - Ekobrottsmyndigheten
Create successful ePaper yourself
Turn your PDF publications into a flip-book with our unique Google optimized e-Paper software.
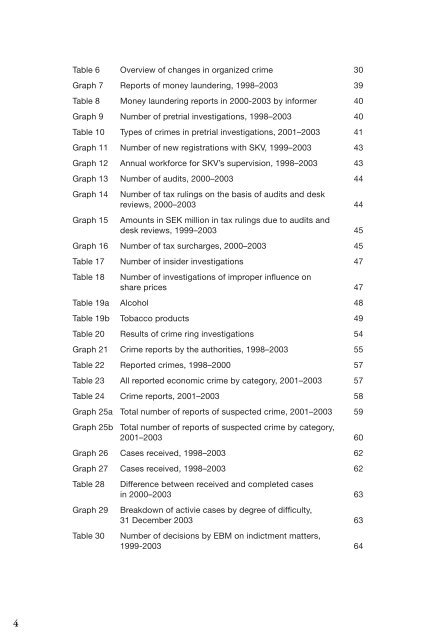
Table 6 Overview of changes in organized <strong>crime</strong> 30<br />
Graph 7 Reports of money laundering, 1998–2003 39<br />
Table 8 Money laundering <strong>report</strong>s in 2000-2003 by informer 40<br />
Graph 9 Number of pretrial investigations, 1998–2003 40<br />
Table 10 Types of <strong>crime</strong>s in pretrial investigations, 2001–2003 41<br />
Graph 11 Number of new registrations with SKV, 1999–2003 43<br />
Graph 12 Annual workforce for SKV’s supervision, 1998–2003 43<br />
Graph 13 Number of audits, 2000–2003 44<br />
Graph 14 Number of tax rulings on the basis of audits and desk<br />
reviews, 2000–2003 44<br />
Graph 15 Amounts in SEK million in tax rulings due to audits and<br />
desk reviews, 1999–2003 45<br />
Graph 16 Number of tax surcharges, 2000–2003 45<br />
Table 17 Number of insider investigations 47<br />
Table 18 Number of investigations of improper influence on<br />
share prices 47<br />
Table 19a Alcohol 48<br />
Table 19b Tobacco products 49<br />
Table 20 Results of <strong>crime</strong> ring investigations 54<br />
Graph 21 Crime <strong>report</strong>s by the authorities, 1998–2003 55<br />
Table 22 Reported <strong>crime</strong>s, 1998–2000 57<br />
Table 23 All <strong>report</strong>ed economic <strong>crime</strong> by category, 2001–2003 57<br />
Table 24 Crime <strong>report</strong>s, 2001–2003 58<br />
Graph 25a Total number of <strong>report</strong>s of suspected <strong>crime</strong>, 2001–2003 59<br />
Graph 25b Total number of <strong>report</strong>s of suspected <strong>crime</strong> by category,<br />
2001–2003 60<br />
Graph 26 Cases received, 1998–2003 62<br />
Graph 27 Cases received, 1998–2003 62<br />
Table 28 Difference between received and completed cases<br />
in 2000–2003 63<br />
Graph 29 Breakdown of activie cases by degree of difficulty,<br />
31 December 2003 63<br />
Table 30 Number of decisions by EBM on indictment matters,<br />
1999-2003 64<br />
4


