Economic crime report 2004 - Ekobrottsmyndigheten
Economic crime report 2004 - Ekobrottsmyndigheten
Economic crime report 2004 - Ekobrottsmyndigheten

You also want an ePaper? Increase the reach of your titles
YUMPU automatically turns print PDFs into web optimized ePapers that Google loves.
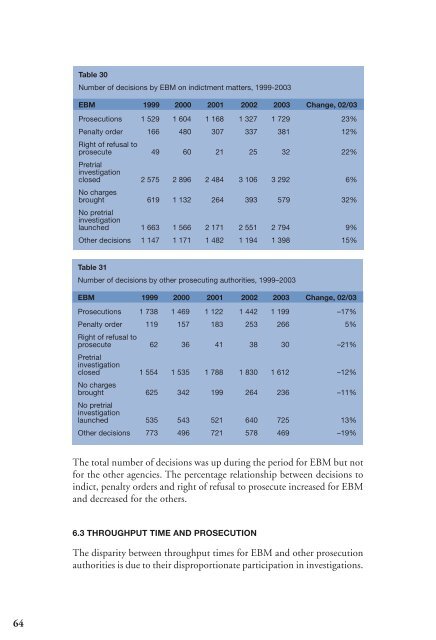
Table 30<br />
Number of decisions by EBM on indictment matters, 1999-2003<br />
EBM 1999 2000 2001 2002 2003 Change, 02/03<br />
Prosecutions 1 529 1 604 1 168 1 327 1 729 23%<br />
Penalty order 166 480 307 337 381 12%<br />
Right of refusal to<br />
prosecute 49 60 21 25 32 22%<br />
Pretrial<br />
investigation<br />
closed 2 575 2 896 2 484 3 106 3 292 6%<br />
No charges<br />
brought 619 1 132 264 393 579 32%<br />
No pretrial<br />
investigation<br />
launched 1 663 1 566 2 171 2 551 2 794 9%<br />
Other decisions 1 147 1 171 1 482 1 194 1 398 15%<br />
Table 31<br />
Number of decisions by other prosecuting authorities, 1999–2003<br />
EBM 1999 2000 2001 2002 2003 Change, 02/03<br />
Prosecutions 1 738 1 469 1 122 1 442 1 199 –17%<br />
Penalty order 119 157 183 253 266 5%<br />
Right of refusal to<br />
prosecute 62 36 41 38 30 –21%<br />
Pretrial<br />
investigation<br />
closed 1 554 1 535 1 788 1 830 1 612 –12%<br />
No charges<br />
brought 625 342 199 264 236 –11%<br />
No pretrial<br />
investigation<br />
launched 535 543 521 640 725 13%<br />
Other decisions 773 496 721 578 469 –19%<br />
The total number of decisions was up during the period for EBM but not<br />
for the other agencies. The percentage relationship between decisions to<br />
indict, penalty orders and right of refusal to prosecute increased for EBM<br />
and decreased for the others.<br />
6.3 THROUGHPUT TIME AND PROSECUTION<br />
The disparity between throughput times for EBM and other prosecution<br />
authorities is due to their disproportionate participation in investigations.<br />
64