Economic crime report 2004 - Ekobrottsmyndigheten
Economic crime report 2004 - Ekobrottsmyndigheten
Economic crime report 2004 - Ekobrottsmyndigheten

Create successful ePaper yourself
Turn your PDF publications into a flip-book with our unique Google optimized e-Paper software.
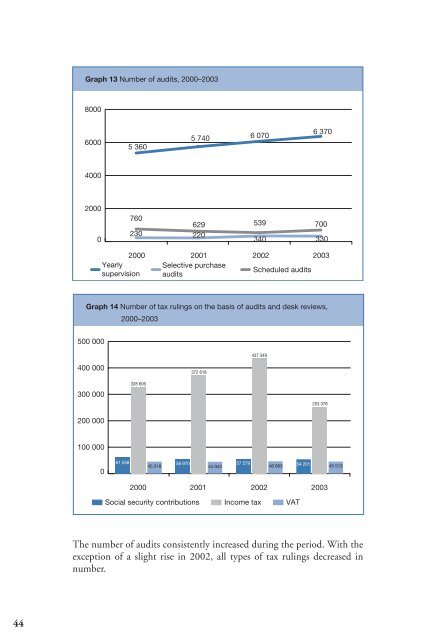
Graph 13 Number of audits, 2000–2003<br />
8000<br />
6000<br />
5 360<br />
5 740<br />
6 070<br />
6 370<br />
4000<br />
2000<br />
0<br />
760<br />
230<br />
629<br />
220<br />
539<br />
700<br />
340 330<br />
2000 2001 2002 2003<br />
Yearly<br />
Selective purchase<br />
Scheduled audits<br />
supervision audits<br />
Graph 14 Number of tax rulings on the basis of audits and desk reviews,<br />
2000–2003<br />
500 000<br />
437 349<br />
400 000<br />
372 618<br />
300 000<br />
200 000<br />
328 606<br />
253 378<br />
100 000<br />
0<br />
61 558<br />
45 218<br />
56 970<br />
44 943<br />
57 579<br />
46 663 54 201<br />
45 513<br />
2000 2001 2002 2003<br />
Social security contributions Income tax VAT<br />
The number of audits consistently increased during the period. With the<br />
exception of a slight rise in 2002, all types of tax rulings decreased in<br />
number.<br />
44