- Page 1 and 2:
Investigating carotenoid loss after
- Page 3 and 4:
DECLARATION I certify that this wor
- Page 5 and 6:
ACKNOWLEDGEMENTS I am deeply gratef
- Page 7 and 8:
CONTENTS CHAPTER 1.! LITERATURE REV
- Page 9 and 10:
4.3.2! Effect of trial and sweet po
- Page 11 and 12:
1.1 BACKGROUND 1.1.1 Introduction C
- Page 13 and 14:
3 1. Literature review It is estima
- Page 15 and 16:
5 1. Literature review food corresp
- Page 17 and 18: - the leaves that make energy and s
- Page 19 and 20: 9 1. Literature review Uganda and M
- Page 21 and 22: 11 1. Literature review communicati
- Page 23 and 24: 13 1. Literature review soya grains
- Page 25 and 26: 15 1. Literature review Drying is a
- Page 27 and 28: 17 1. Literature review Modelling o
- Page 29 and 30: 19 1. Literature review Other types
- Page 31 and 32: 21 1. Literature review The perform
- Page 33 and 34: 23 1. Literature review degradation
- Page 35 and 36: 25 1. Literature review carotene an
- Page 37 and 38: 27 1. Literature review (Rees, NRI,
- Page 39 and 40: 29 1. Literature review red (>800 n
- Page 41 and 42: 31 1. Literature review Figure 1-17
- Page 43 and 44: 33 1. Literature review induced by
- Page 45 and 46: 35 1. Literature review Enzymatic c
- Page 47 and 48: 37 1. Literature review Volatile pr
- Page 49 and 50: 39 1. Literature review Carotenoid
- Page 51 and 52: Table 1-5: Effect of type of proces
- Page 53 and 54: Comparison of losses in drying proc
- Page 55 and 56: 45 1. Literature review observed we
- Page 57 and 58: 47 1. Literature review Different p
- Page 59 and 60: Oxygen 49 1. Literature review Oxyg
- Page 61 and 62: 51 1. Literature review the storage
- Page 63 and 64: 2.2.2 Root samples 53 2. Assessment
- Page 65 and 66: 2.2.5 Water activity 55 2. Assessme
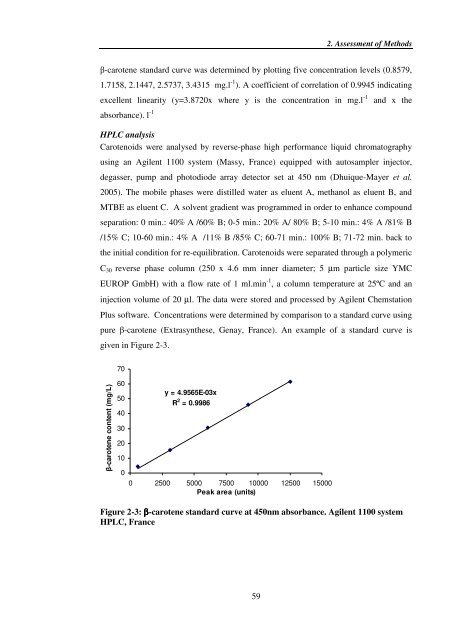
- Page 67: 57 2. Assessment of Methods below t
- Page 71 and 72: 61 2. Assessment of Methods indicat
- Page 73 and 74: 63 2. Assessment of Methods were we
- Page 75 and 76: 65 2. Assessment of Methods Table 2
- Page 77 and 78: 67 2. Assessment of Methods Intra-l
- Page 79 and 80: 69 2. Assessment of Methods Signifi
- Page 81 and 82: 71 2. Assessment of Methods Table 2
- Page 83 and 84: Content (µg/g) Content (µg/g) Con
- Page 85 and 86: 75 2. Assessment of Methods way-ANO
- Page 87 and 88: 77 2. Assessment of Methods puree.
- Page 89 and 90: Percentage loss "a" redness 45% 40%
- Page 91 and 92: CHAPTER 3. 81 3. Preliminary study
- Page 93 and 94: 83 3. Preliminary study Figure 3-1:
- Page 95 and 96: 85 3. Preliminary study Air velocit
- Page 97 and 98: 3.2.10 Statistical analyses 87 3. P
- Page 99 and 100: 89 3. Preliminary study because it
- Page 101 and 102: Sample area (cm2) 91 3. Preliminary
- Page 103 and 104: Figure 3-9: UV-Visible spectrum of
- Page 105 and 106: 95 3. Preliminary study Mulokozi an
- Page 107 and 108: 97 3. Preliminary study One hundred
- Page 109 and 110: 99 4. Ugandan field study respectiv
- Page 111 and 112: Transmittance (%) 101 4. Ugandan fi
- Page 113 and 114: 4.2.5 Total carotenoids extraction
- Page 115 and 116: 105 4. Ugandan field study The dryi
- Page 117 and 118: 107 4. Ugandan field study individu
- Page 119 and 120:
109 4. Ugandan field study values a
- Page 121 and 122:
111 4. Ugandan field study caroteno
- Page 123 and 124:
113 4. Ugandan field study observed
- Page 125 and 126:
115 4. Ugandan field study OFSP chi
- Page 127 and 128:
117 5. Mozambican field study carot
- Page 129 and 130:
119 5. Mozambican field study kg (p
- Page 131 and 132:
121 5. Mozambican field study Table
- Page 133 and 134:
123 5. Mozambican field study carot
- Page 135 and 136:
Tot. carotenoid content (!g/g) Tot.
- Page 137 and 138:
127 5. Mozambican field study 5.3.6
- Page 139 and 140:
a b c c 129 5. Mozambican field stu
- Page 141 and 142:
131 5. Mozambican field study Table
- Page 143 and 144:
133 5. Mozambican field study #-car
- Page 145 and 146:
135 5. Mozambican field study carot
- Page 147 and 148:
CHAPTER 6. 137 6. Effect of pre-tre
- Page 149 and 150:
139 6. Effect of pre-treatment out
- Page 151 and 152:
141 6. Effect of pre-treatment afte
- Page 153 and 154:
143 6. Effect of pre-treatment leve
- Page 155 and 156:
145 6. Effect of pre-treatment Citr
- Page 157 and 158:
147 6. Effect of pre-treatment trea
- Page 159 and 160:
149 6. Effect of pre-treatment inte
- Page 161 and 162:
CHAPTER 7. 151 7. Involvement of en
- Page 163 and 164:
7.2.2. pH measurement 153 7. Involv
- Page 165 and 166:
155 7. Involvement of enzymes glyce
- Page 167 and 168:
157 7. Involvement of enzymes Table
- Page 169 and 170:
159 7. Involvement of enzymes carot
- Page 171 and 172:
161 7. Involvement of enzymes carot
- Page 173 and 174:
163 7. Involvement of enzymes Perox
- Page 175 and 176:
CHAPTER 8. 165 8. Study under contr
- Page 177 and 178:
Kilner jar (with metal lever catch
- Page 179 and 180:
Figure 8-2: Storage system for wate
- Page 181 and 182:
8.2.4 Carotenoid analyses 171 8. St
- Page 183 and 184:
8.3 RESULTS & DISCUSSION 8.3.1 Samp
- Page 185 and 186:
175 8. Study under controlled condi
- Page 187 and 188:
177 8. Study under controlled condi
- Page 189 and 190:
179 8. Study under controlled condi
- Page 191 and 192:
181 8. Study under controlled condi
- Page 193 and 194:
k (day-1) k (day-1) 0.10 0.08 0.06
- Page 195 and 196:
185 8. Study under controlled condi
- Page 197 and 198:
187 8. Study under controlled condi
- Page 199 and 200:
189 8. Study under controlled condi
- Page 201 and 202:
191 8. Study under controlled condi
- Page 203 and 204:
193 8. Study under controlled condi
- Page 205 and 206:
CHAPTER 9. GENERAL DISCUSSION AND F
- Page 207 and 208:
197 9. Discussion carotene loss aft
- Page 209 and 210:
199 9. Discussion total carotenoids
- Page 211 and 212:
9.4.2 Varietal influence 201 9. Dis
- Page 213 and 214:
203 9. Discussion 2008). The side e
- Page 215 and 216:
205 9. Discussion Absence of cis-is
- Page 217 and 218:
207 9. Discussion (Chapter 7). Howe
- Page 219 and 220:
209 9. Discussion of these cultivar
- Page 221 and 222:
References 211 References Aguayo, V
- Page 223 and 224:
213 References Bechoff, A., Dhuique
- Page 225 and 226:
215 References Chen, H.E., Peng, H.
- Page 227 and 228:
DIAS (2006) Semi-Annual and Annual
- Page 229 and 230:
219 References Tropical Agriculture
- Page 231 and 232:
221 References has a positive effec
- Page 233 and 234:
223 References Kamiya N. and Nagamu
- Page 235 and 236:
Lee, S.B. and Kim, K.J. (1995) Effe
- Page 237 and 238:
227 References Mills, R.C. and Hart
- Page 239 and 240:
Nestel, P., Bouis, H.E., Meenakshi,
- Page 241 and 242:
231 References Preston, C.M. and Ba
- Page 243 and 244:
Simon, P.W. (1997) Plant pigments f
- Page 245 and 246:
235 References Tran, T.H., Nguyen,
- Page 247 and 248:
237 References Walter, W.M., Purcel
- Page 249 and 250:
! ! ! ! ! ! ! ! ! ! ! ! ! ! ! ! ! A
- Page 251 and 252:
Arrhenius model: = ∞ − Ea RT ek
- Page 253 and 254:
242 Appendix 1 B/Calculation of Arr
- Page 255 and 256:
Temperature is integrated for each
- Page 257 and 258:
2) Integration of temperature in Ug
- Page 259 and 260:
Appendix 2b: Dryers cost in Lualua,
- Page 261 and 262:
250 Appendix 2 Technical informatio
- Page 263 and 264:
252 Appendix 2 Technical informatio
- Page 265 and 266:
Open air flat and sloped dryers 254
- Page 267 and 268:
Appendix 3: Total carotenoids metho
- Page 269 and 270:
4. Partition - Pour 40 ml of Petrol
- Page 271 and 272:
Publications: Publications, award a