Lunenburg Part 2 - Section 5 - Social Vulnerability - August 30.pdf
Lunenburg Part 2 - Section 5 - Social Vulnerability - August 30.pdf
Lunenburg Part 2 - Section 5 - Social Vulnerability - August 30.pdf

You also want an ePaper? Increase the reach of your titles
YUMPU automatically turns print PDFs into web optimized ePapers that Google loves.
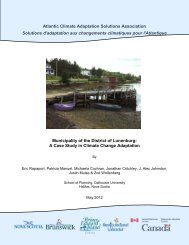
Rural roads throughout the District lead through spectacular scenery. Many are located directly<br />
on the coast, very close to sea level; they are, in fact, the shoreline. In some locations, long<br />
roads lead to only one or two isolated residences. Some of these less-populated roads are<br />
cracked, uneven and potholed.<br />
In many locations both along the coast, such as the Stonehurst/Blue Rocks area, along the<br />
LaHave River, and Green Bay, rock armouring has been placed to protect roads and residences.<br />
In some areas, storm damage to this armouring is clearly visible.<br />
The road and powerlines on the narrow Crescent Beach leading to the LaHave Islands are close<br />
to sea level and appear precarious and highly exposed. Wooden cribbing and rose bushes are in<br />
place to help stabilize the fragile sand dunes.<br />
Summary of Field Observations<br />
Field observations performed in the District of <strong>Lunenburg</strong> do not provide conclusive knowledge<br />
of social vulnerability. They suggest, however, the potential for loss of access or loss of electrical<br />
power to island and peninsular communities, or that new residents may have limited awareness<br />
of the hazards of locating directly on the coast, and are concerns relevant to climate change<br />
impacts in the study area. Field observations also suggest that households and individuals with<br />
lower socioeconomic status are dispersed throughout the area, rather than being concentrated<br />
in particular communities or areas.<br />
Index of <strong>Social</strong> <strong>Vulnerability</strong><br />
The following section discusses the results of the index of social vulnerability. The level of social<br />
vulnerability in each dissemination area is calculated by measuring the prevalence of each factor<br />
of social vulnerability as a percentage of the total population, and expressing that percentage by<br />
the number of standard deviations that it falls above or below the mean for Nova Scotia.<br />
Because all statistics used in the study measure proportion of the population that experiences a<br />
characteristic that increases social vulnerability, higher scores always indicate greater social<br />
vulnerability.<br />
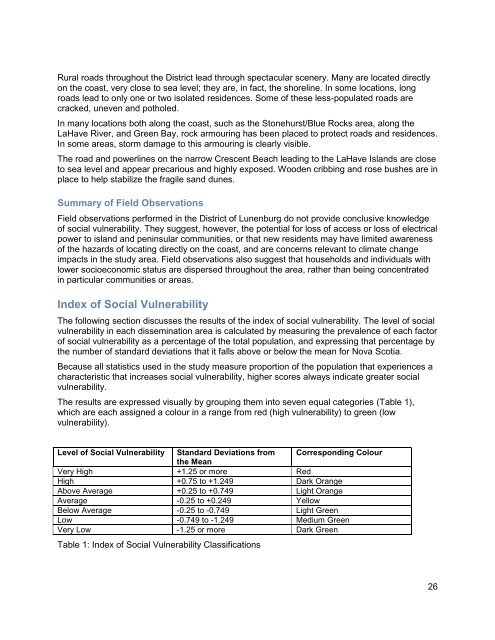
The results are expressed visually by grouping them into seven equal categories (Table 1),<br />
which are each assigned a colour in a range from red (high vulnerability) to green (low<br />
vulnerability).<br />
Level of <strong>Social</strong> <strong>Vulnerability</strong> Standard Deviations from Corresponding Colour<br />
the Mean<br />
Very High +1.25 or more Red<br />
High +0.75 to +1.249 Dark Orange<br />
Above Average +0.25 to +0.749 Light Orange<br />
Average -0.25 to +0.249 Yellow<br />
Below Average -0.25 to -0.749 Light Green<br />
Low -0.749 to -1.249 Medium Green<br />
Very Low -1.25 or more Dark Green<br />
Table 1: Index of <strong>Social</strong> <strong>Vulnerability</strong> Classifications<br />
26