Lunenburg Part 2 - Section 5 - Social Vulnerability - August 30.pdf
Lunenburg Part 2 - Section 5 - Social Vulnerability - August 30.pdf
Lunenburg Part 2 - Section 5 - Social Vulnerability - August 30.pdf

You also want an ePaper? Increase the reach of your titles
YUMPU automatically turns print PDFs into web optimized ePapers that Google loves.
<strong>Social</strong> <strong>Vulnerability</strong> scores in the District range from Below Average to Above Average. As a<br />
general pattern overall, Average and Below Average social vulnerability prevails throughout the<br />
District. One of the few exceptions to this pattern is Dissemination Area 117 (the La Have<br />
Islands and the lower La Have River area) which exhibits above average vulnerability when all<br />
vulnerability indicators are considered together. The result for this area should be of particular<br />
interest to the municipality in the context of examining social vulnerability to coastal climate<br />
change impacts.<br />
The maps for each indicator of social vulnerability, accompanied by a description of the indicator<br />
and the pattern for each indicator are provided in Appendix C. The maps suggest that the Above<br />
Average social vulnerability in District 117 derives from vulnerability of a higher proportion of<br />
seniors<br />
Profile by Dissemination Area<br />
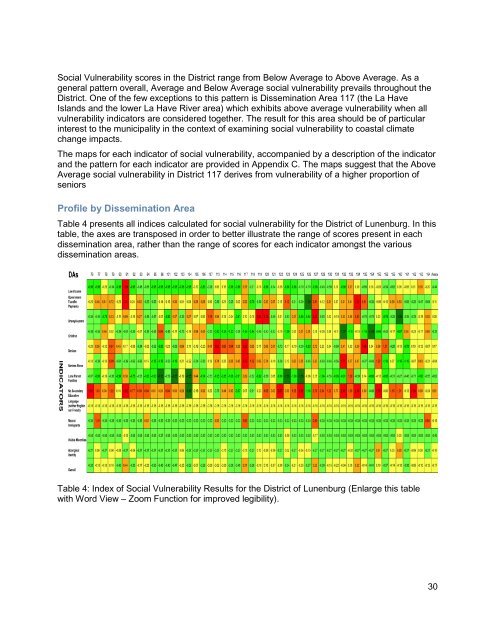
Table 4 presents all indices calculated for social vulnerability for the District of <strong>Lunenburg</strong>. In this<br />
table, the axes are transposed in order to better illustrate the range of scores present in each<br />
dissemination area, rather than the range of scores for each indicator amongst the various<br />
dissemination areas.<br />
Table 4: Index of <strong>Social</strong> <strong>Vulnerability</strong> Results for the District of <strong>Lunenburg</strong> (Enlarge this table<br />
with Word View – Zoom Function for improved legibility).<br />
30