Allegheny River Headwaters Watershed Conservation Plan
Allegheny River Headwaters Watershed Conservation Plan
Allegheny River Headwaters Watershed Conservation Plan

You also want an ePaper? Increase the reach of your titles
YUMPU automatically turns print PDFs into web optimized ePapers that Google loves.
<strong>Allegheny</strong> <strong>River</strong> <strong>Headwaters</strong> <strong>Conservation</strong> <strong>Plan</strong><br />
Chapter 3. Water Resources<br />
Pennsylvania State Water <strong>Plan</strong><br />
In 2008, an updated draft of the Pennsylvania State Water <strong>Plan</strong> was unveiled, providing a vision to<br />
sustain water supply with goals and recommendations. The plan includes an inventory of water<br />
availability, an assessment of current and future water use demands and trends, and an assessment of<br />
resource management alternatives and proposed methods of implementation. It also provides an analysis<br />
of problems and needs associated with specific water resource uses, such as navigation, stormwater<br />
management, and flood control (PA DEP, 2008c).<br />
In the updated Pennsylvania State Water <strong>Plan</strong>, information is broken down into six watershed<br />
regions—Ohio <strong>River</strong>, Great Lakes, Potomac <strong>River</strong>, Delaware <strong>River</strong>, upper/middle and lower<br />
Susquehanna <strong>River</strong>. The <strong>Allegheny</strong> <strong>River</strong> is located within the Ohio region, which is subdivided into<br />
smaller regions; the headwater region is located within the upper <strong>Allegheny</strong> <strong>River</strong> region.<br />
Water Use<br />
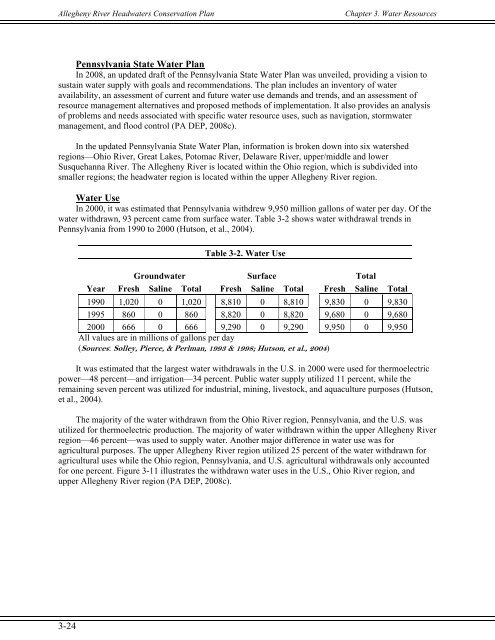
In 2000, it was estimated that Pennsylvania withdrew 9,950 million gallons of water per day. Of the<br />
water withdrawn, 93 percent came from surface water. Table 3-2 shows water withdrawal trends in<br />
Pennsylvania from 1990 to 2000 (Hutson, et al., 2004).<br />
Table 3-2. Water Use<br />
Groundwater Surface Total<br />
Year Fresh Saline Total Fresh Saline Total Fresh Saline Total<br />
1990 1,020 0 1,020 8,810 0 8,810 9,830 0 9,830<br />
1995 860 0 860 8,820 0 8,820 9,680 0 9,680<br />
2000 666 0 666 9,290 0 9,290 9,950 0 9,950<br />
All values are in millions of gallons per day<br />
(Sources: Solley, Pierce, & Perlman, 1993 & 1998; Hutson, et al., 2004)<br />
It was estimated that the largest water withdrawals in the U.S. in 2000 were used for thermoelectric<br />
power—48 percent—and irrigation—34 percent. Public water supply utilized 11 percent, while the<br />
remaining seven percent was utilized for industrial, mining, livestock, and aquaculture purposes (Hutson,<br />
et al., 2004).<br />
The majority of the water withdrawn from the Ohio <strong>River</strong> region, Pennsylvania, and the U.S. was<br />
utilized for thermoelectric production. The majority of water withdrawn within the upper <strong>Allegheny</strong> <strong>River</strong><br />
region—46 percent—was used to supply water. Another major difference in water use was for<br />
agricultural purposes. The upper <strong>Allegheny</strong> <strong>River</strong> region utilized 25 percent of the water withdrawn for<br />
agricultural uses while the Ohio region, Pennsylvania, and U.S. agricultural withdrawals only accounted<br />
for one percent. Figure 3-11 illustrates the withdrawn water uses in the U.S., Ohio <strong>River</strong> region, and<br />
upper <strong>Allegheny</strong> <strong>River</strong> region (PA DEP, 2008c).<br />
3-24