Lab Manual - eScience Labs
Lab Manual - eScience Labs
Lab Manual - eScience Labs

Create successful ePaper yourself
Turn your PDF publications into a flip-book with our unique Google optimized e-Paper software.
<strong>Lab</strong> 1 : Scienfic Method<br />
Controlled Variable: This variable, or variables (there could be many) reflect the factors<br />
that could influence the results of the experiment, but are not the planned changes the<br />
scienst is expecng (by changing the independent variable). These variables must be<br />
controlled so that the results can be associated with some change in the independent<br />
variable.<br />
When designing the experiment, establish a clear and concise procedure. Controls must be idenfied to<br />
eliminate compounding changes that can influence the results. Oen mes, the hardest part of designing<br />
an experiment is not figuring out how to test the one factor you focus on, but in trying to eliminate<br />
the oen hidden influences that can skew results. Taking notes when conducng an experiment is important,<br />
whether it is recording the temperature, humidity, me of day, or another environmental condion<br />
that may have an impact on the results. Also remember that replicaon is fundamental to scien-<br />
fic experiments. Before drawing conclusions, make sure your data is repeatable. In other words, make<br />
sure the experiment provides significant results over mulple trials.<br />
Oen, the best way to organize data for analysis is as a table or a graph. Remember, any table or graph<br />
should be able to stand on its own. In other words, another scienst should be able to pick up the table<br />
or graph and have all of the informaon necessary to interpret it, with no other informaon.<br />
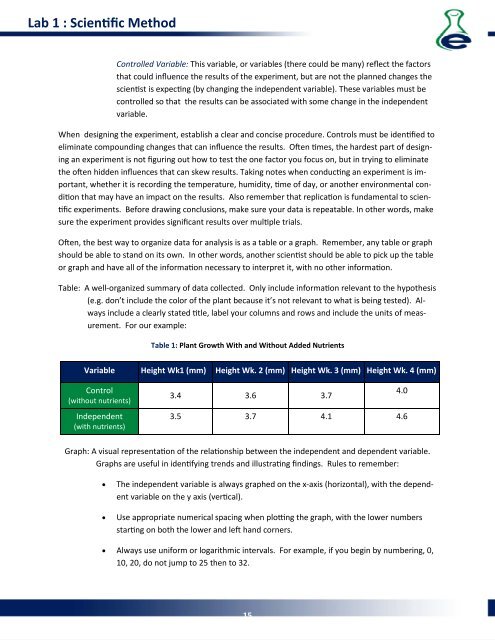
Table: A well-organized summary of data collected. Only include informaon relevant to the hypothesis<br />
(e.g. don’t include the color of the plant because it’s not relevant to what is being tested). Always<br />
include a clearly stated tle, label your columns and rows and include the units of measurement.<br />
For our example:<br />
Table 1: Plant Growth With and Without Added Nutrients<br />
Variable Height Wk1 (mm) Height Wk. 2 (mm) Height Wk. 3 (mm) Height Wk. 4 (mm)<br />
Control<br />
(without nutrients)<br />
Independent<br />
(with nutrients)<br />
3.4 3.6 3.7<br />
3.5 3.7 4.1 4.6<br />
4.0<br />
Graph: A visual representaon of the relaonship between the independent and dependent variable.<br />
Graphs are useful in idenfying trends and illustrang findings. Rules to remember:<br />
• The independent variable is always graphed on the x-axis (horizontal), with the dependent<br />
variable on the y axis (vercal).<br />
• Use appropriate numerical spacing when plong the graph, with the lower numbers<br />
starng on both the lower and le hand corners.<br />
• Always use uniform or logarithmic intervals. For example, if you begin by numbering, 0,<br />
10, 20, do not jump to 25 then to 32.<br />
15