Beer & A Better World - Anheuser-Busch InBev
Beer & A Better World - Anheuser-Busch InBev
Beer & A Better World - Anheuser-Busch InBev

You also want an ePaper? Increase the reach of your titles
YUMPU automatically turns print PDFs into web optimized ePapers that Google loves.
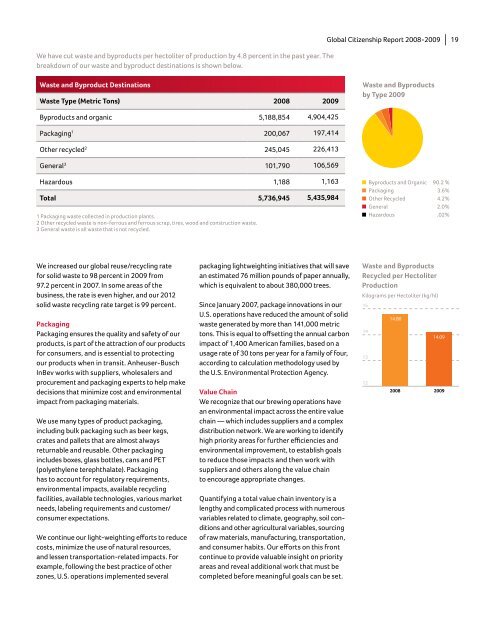
We have cut waste and byproducts per hectoliter of production by 4.8 percent in the past year. The<br />
breakdown of our waste and byproduct destinations is shown below.<br />
Waste and Byproduct Destinations<br />
Waste Type (Metric Tons) 2008 2009<br />
Byproducts and organic 5,188,854 4,904,425<br />
Packaging 1 200,067 197,414<br />
Other recycled 2 245,045 226,413<br />
General 3 101,790 106,569<br />
Hazardous 1,188 1,163<br />
Total 5,736,945 5,435,984<br />
1 Packaging waste collected in production plants.<br />
2 Other recycled waste is non-ferrous and ferrous scrap, tires, wood and construction waste.<br />
3 General waste is all waste that is not recycled.<br />
We increased our global reuse/recycling rate<br />
for solid waste to 98 percent in 2009 from<br />
97.2 percent in 2007. In some areas of the<br />
business, the rate is even higher, and our 2012<br />
solid waste recycling rate target is 99 percent.<br />
Packaging<br />
Packaging ensures the quality and safety of our<br />
products, is part of the attraction of our products<br />
for consumers, and is essential to protecting<br />
our products when in transit. <strong>Anheuser</strong>-<strong>Busch</strong><br />
<strong>InBev</strong> works with suppliers, wholesalers and<br />
procurement and packaging experts to help make<br />
decisions that minimize cost and environmental<br />
impact from packaging materials.<br />
We use many types of product packaging,<br />
including bulk packaging such as beer kegs,<br />
crates and pallets that are almost always<br />
returnable and reusable. Other packaging<br />
includes boxes, glass bottles, cans and PET<br />
(polyethylene terephthalate). Packaging<br />
has to account for regulatory requirements,<br />
environmental impacts, available recycling<br />
facilities, available technologies, various market<br />
needs, labeling requirements and customer/<br />
consumer expectations.<br />
We continue our light-weighting efforts to reduce<br />
costs, minimize the use of natural resources,<br />
and lessen transportation-related impacts. For<br />
example, following the best practice of other<br />
zones, U.S. operations implemented several<br />
packaging lightweighting initiatives that will save<br />
an estimated 76 million pounds of paper annually,<br />
which is equivalent to about 380,000 trees.<br />
Since January 2007, package innovations in our<br />
U.S. operations have reduced the amount of solid<br />
waste generated by more than 141,000 metric<br />
tons. This is equal to offsetting the annual carbon<br />
impact of 1,400 American families, based on a<br />
usage rate of 30 tons per year for a family of four,<br />
according to calculation methodology used by<br />
the U.S. Environmental Protection Agency.<br />
Value Chain<br />
We recognize that our brewing operations have<br />
an environmental impact across the entire value<br />
chain — which includes suppliers and a complex<br />
distribution network. We are working to identify<br />
high priority areas for further efficiencies and<br />
environmental improvement, to establish goals<br />
to reduce those impacts and then work with<br />
suppliers and others along the value chain<br />
to encourage appropriate changes.<br />
Quantifying a total value chain inventory is a<br />
lengthy and complicated process with numerous<br />
variables related to climate, geography, soil conditions<br />
and other agricultural variables, sourcing<br />
of raw materials, manufacturing, transportation,<br />
and consumer habits. Our efforts on this front<br />
continue to provide valuable insight on priority<br />
areas and reveal additional work that must be<br />
completed before meaningful goals can be set.<br />
Global Citizenship Report 2008-2009 | 19<br />
Waste and Byproducts<br />
by Type 2009<br />
15<br />
14<br />
13<br />
12<br />
Byproducts and Organic 90.2 %<br />
Packaging 3.6%<br />
Other Recycled 4.2%<br />
General 2.0%<br />
Hazardous .02%<br />
Waste and Byproducts<br />
Recycled per Hectoliter<br />
Production<br />
Kilograms per Hectoliter (kg/hl)<br />
14.80<br />
14.09<br />
2008 2009