Beer & A Better World - Anheuser-Busch InBev
Beer & A Better World - Anheuser-Busch InBev
Beer & A Better World - Anheuser-Busch InBev

Create successful ePaper yourself
Turn your PDF publications into a flip-book with our unique Google optimized e-Paper software.
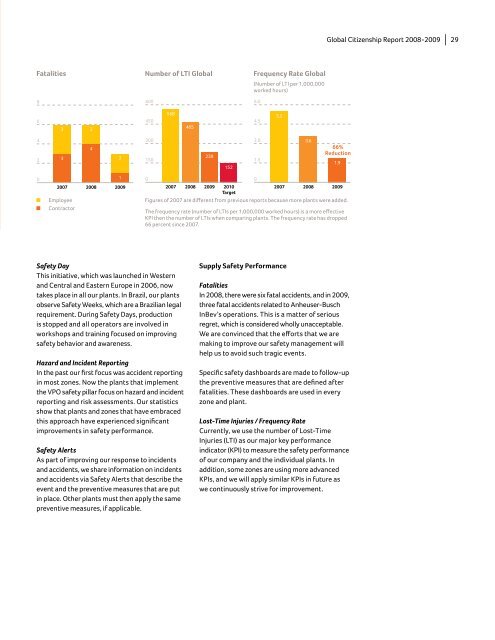
Fatalities<br />
8<br />
6<br />
4<br />
2<br />
0<br />
3<br />
2<br />
4<br />
3 2<br />
2007 2008 2009<br />
Employee<br />
Contractor<br />
Number of LTI Global<br />
600<br />
450<br />
300<br />
150<br />
Safety Day<br />
This initiative, which was launched in Western<br />
and Central and Eastern Europe in 2006, now<br />
takes place in all our plants. In Brazil, our plants<br />
observe Safety Weeks, which are a Brazilian legal<br />
requirement. During Safety Days, production<br />
is stopped and all operators are involved in<br />
workshops and training focused on improving<br />
safety behavior and awareness.<br />
Hazard and Incident Reporting<br />
In the past our first focus was accident reporting<br />
in most zones. Now the plants that implement<br />
the VPO safety pillar focus on hazard and incident<br />
reporting and risk assessments. Our statistics<br />
show that plants and zones that have embraced<br />
this approach have experienced significant<br />
improvements in safety performance.<br />
Safety Alerts<br />
As part of improving our response to incidents<br />
and accidents, we share information on incidents<br />
and accidents via Safety Alerts that describe the<br />
event and the preventive measures that are put<br />
in place. Other plants must then apply the same<br />
preventive measures, if applicable.<br />
1<br />
0<br />
568<br />
465<br />
238<br />
152<br />
2007 2008 2009 2010<br />
Target<br />
6.0<br />
4.5<br />
3.0<br />
1.5<br />
Supply Safety Performance<br />
Frequency Rate Global<br />
(Number of LTI per 1,000,000<br />
worked hours)<br />
0<br />
2007 2008 2009<br />
Figures of 2007 are different from previous reports because more plants were added.<br />
The frequency rate (number of LTIs per 1,000,000 worked hours) is a more effective<br />
KPI then the number of LTIs when comparing plants. The frequency rate has dropped<br />
66 percent since 2007.<br />
Fatalities<br />
In 2008, there were six fatal accidents, and in 2009,<br />
three fatal accidents related to <strong>Anheuser</strong>-<strong>Busch</strong><br />
<strong>InBev</strong>’s operations. This is a matter of serious<br />
regret, which is considered wholly unacceptable.<br />
We are convinced that the efforts that we are<br />
making to improve our safety management will<br />
help us to avoid such tragic events.<br />
Specific safety dashboards are made to follow-up<br />
the preventive measures that are defined after<br />
fatalities. These dashboards are used in every<br />
zone and plant.<br />
Lost-Time Injuries / Frequency Rate<br />
Currently, we use the number of Lost-Time<br />
Injuries (LTI) as our major key performance<br />
indicator (KPI) to measure the safety performance<br />
of our company and the individual plants. In<br />
addition, some zones are using more advanced<br />
KPIs, and we will apply similar KPIs in future as<br />
we continuously strive for improvement.<br />
5.5<br />
3.6<br />
Global Citizenship Report 2008-2009 | 29<br />
66%<br />
Reduction<br />
1.9