- Page 1 and 2: BIOTRONIKEstella Pulse GeneratorsTe
- Page 3 and 4: ContentsEstella Pulse Generators Te
- Page 5 and 6: Estella Pulse Generators Technical
- Page 7 and 8: Estella Pulse Generators Technical
- Page 9 and 10: 1. Device DescriptionEstella Pulse
- Page 11 and 12: 2. IndicationsEstella Pulse Generat
- Page 13 and 14: Estella Pulse Generators Technical
- Page 15 and 16: 4. Warnings and PrecautionsEstella
- Page 17 and 18: Estella Pulse Generators Technical
- Page 19 and 20: Estella Pulse Generators Technical
- Page 21 and 22: Estella Pulse Generators Technical
- Page 23 and 24: Estella Pulse Generators Technical
- Page 25 and 26: 5. Adverse EventsNOTE:Estella Pulse
- Page 27 and 28: Estella Pulse Generators Technical
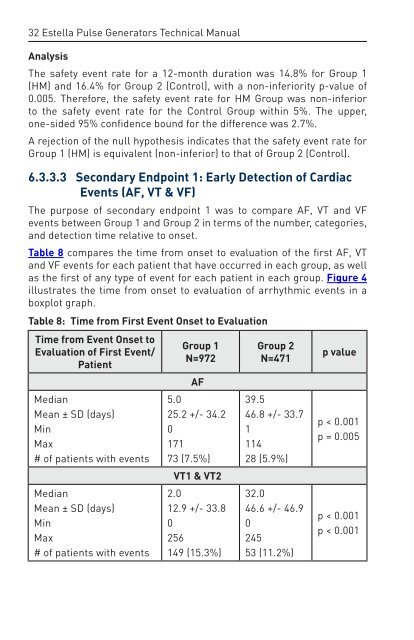
- Page 29 and 30: Estella Pulse Generators Technical
- Page 33 and 34: Estella Pulse Generators Technical
- Page 35 and 36: 6.2.4 Clinical Study ConclusionsEst
- Page 37 and 38: Estella Pulse Generators Technical
- Page 39: Estella Pulse Generators Technical
- Page 43 and 44: Estella Pulse Generators Technical
- Page 45 and 46: Estella Pulse Generators Technical
- Page 47 and 48: Estella Pulse Generators Technical
- Page 49 and 50: 6.4.4.7 Additional Study ResultsEst
- Page 51 and 52: Estella Pulse Generators Technical
- Page 53 and 54: 7. Programmable ParametersEstella P
- Page 55 and 56: Estella Pulse Generators Technical
- Page 57 and 58: 7.2.3 Scan HysteresisEstella Pulse
- Page 59 and 60: Estella Pulse Generators Technical
- Page 61 and 62: Estella Pulse Generators Technical
- Page 63 and 64: Estella Pulse Generators Technical
- Page 65 and 66: 7.5.3.2 AV HysteresisEstella Pulse
- Page 67 and 68: Estella Pulse Generators Technical
- Page 69 and 70: Estella Pulse Generators Technical
- Page 71 and 72: Figure 13: Automatic Sensor GainEst
- Page 73 and 74: Table 20: Rate DecreaseDecrease inR
- Page 75 and 76: Estella Pulse Generators Technical
- Page 77 and 78: 7.11.2.1 PMT Detection and Terminat
- Page 79 and 80: Table 21: Acronyms and TermsCVATMTe
- Page 81 and 82: Estella Pulse Generators Technical
- Page 83 and 84: Estella Pulse Generators Technical
- Page 85 and 86: Estella Pulse Generators Technical
- Page 87 and 88: Estella Pulse Generators Technical
- Page 89 and 90: Estella Pulse Generators Technical
- Page 91 and 92:
Estella Pulse Generators Technical
- Page 93 and 94:
Estella Pulse Generators Technical
- Page 95 and 96:
Estella Pulse Generators Technical
- Page 97 and 98:
Estella Pulse Generators Technical
- Page 99 and 100:
Estella Pulse Generators Technical
- Page 101 and 102:
Estella Pulse Generators Technical
- Page 103 and 104:
Estella Pulse Generators Technical
- Page 105 and 106:
Estella Pulse Generators Technical
- Page 107 and 108:
Estella Pulse Generators Technical
- Page 109 and 110:
9. Other Functions/FeaturesEstella
- Page 111 and 112:
Estella Pulse Generators Technical
- Page 113 and 114:
10. Product Storage and Handling10.
- Page 115 and 116:
11. Lead ConnectionEstella Pulse Ge
- Page 117 and 118:
Estella Pulse Generators Technical
- Page 119 and 120:
12. Follow-up Procedures12.1 Genera
- Page 121 and 122:
Estella Pulse Generators Technical
- Page 123 and 124:
Estella Pulse Generators Technical
- Page 125 and 126:
Estella Pulse Generators Technical
- Page 127 and 128:
Table 33: Nominal Pulse Generator L
- Page 129 and 130:
14. ExplantationEstella Pulse Gener
- Page 131 and 132:
Estella Pulse Generators Technical
- Page 133 and 134:
Estella Pulse Generators Technical
- Page 135 and 136:
AV Repetitive Hysteresis (Dual cham
- Page 137 and 138:
Estella Pulse Generators Technical
- Page 139 and 140:
Periodic TransmissionOff, 30, 60, 9
- Page 141 and 142:
ParameterEstella Pulse Generators T
- Page 143 and 144:
16. Order InformationPulse Generato
- Page 145 and 146:
Estella Pulse Generators Technical
- Page 147 and 148:
Estella Pulse Generators Technical
- Page 149 and 150:
The AAI mode is conditionally indic
- Page 151 and 152:
Estella Pulse Generators Technical
- Page 154:
Manufactured by:BIOTRONIK SE & Co.