Systems Agronomic and Economic Evaluation of Cotton Varieties in ...
Systems Agronomic and Economic Evaluation of Cotton Varieties in ...
Systems Agronomic and Economic Evaluation of Cotton Varieties in ...

You also want an ePaper? Increase the reach of your titles
YUMPU automatically turns print PDFs into web optimized ePapers that Google loves.
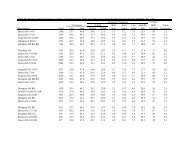
Entry L<strong>in</strong>t Seed Bur cotton L<strong>in</strong>t Seed L<strong>in</strong>t loan L<strong>in</strong>t Seed Total G<strong>in</strong>n<strong>in</strong>g Seed/technologyturnout turnout yield yield yield value value value value cost costTest average 32.7 49.1 5269 1725 2586 0.5321 917.95 323.23 1241.18 158.08 95.45CV, % 4.9 5.0 7.3 7.4 7.4 4.7 7.4 7.4 7.4 7.3 --OSL 0.0005 0.3143 0.4786 0.0021 0.0875 † 0.0122 0.0006 0.0873 † 0.0034 0.4790 --LSD 2.7 NS NS 216 268 0.0421 115.36 33.55 155.85 NS --For net value/acre, means with<strong>in</strong> a column with the same letter are not significantly different at the 0.05 probability level.CV - coefficient <strong>of</strong> variation.OSL - observed significance level, or probability <strong>of</strong> a greater F value.LSD - least significant difference at the 0.05 level, † <strong>in</strong>dicates significance at the 0.10 level, NS - not significant.Note: some columns may not add up due to round<strong>in</strong>g error.Netvalue987.668.10.0009136.25Table 5. Harvest results from the Large Plot Irrigated <strong>Cotton</strong> Variety Trial, Dudley Ponhert Farm, Carson County, TX, 2012.-------- % -------- ------------- lb/acre ------------- $/lb ------------------------------------------------- $/acre -------------------------------------------------107Deltap<strong>in</strong>e 104B2RF 35.8 51.5 5400 1932 2780 0.5397 1042.89 347.53 1390.41 161.99 98.60 1129.83 aFiberMax 9250GL 34.5 50.0 5529 1906 2763 0.5263 1003.25 345.32 1348.57 165.88 92.62 1090.07 abFiberMax 2011GT 34.9 47.2 5420 1893 2558 0.5168 978.50 319.81 1298.31 162.61 89.35 1046.35 abcNexGen 2051B2RF 32.8 49.7 5436 1782 2700 0.5362 955.33 337.44 1292.77 163.08 93.54 1036.16 abcNexGen 1551RF 32.2 51.1 5064 1629 2586 0.5710 930.41 323.28 1253.68 151.92 76.01 1025.76 abcAll-Tex Edge B2RF 31.6 50.5 5420 1710 2736 0.5397 922.77 342.00 1264.76 162.59 97.82 1004.35 abcFiberMax 9180B2F 34.9 48.8 5245 1831 2561 0.5080 930.25 320.11 1250.37 157.36 104.69 988.31 bcDeltap<strong>in</strong>e 1212B2RF 30.9 47.5 5436 1678 2581 0.5487 920.44 322.57 1243.01 163.08 102.34 977.59 bcFiberMax 9058F 34.1 48.0 4910 1673 2356 0.5505 920.73 294.47 1215.20 147.29 92.81 975.10 bcPhytoGen 367WRF 31.5 48.4 5363 1688 2597 0.5167 872.11 324.59 1196.70 160.90 105.43 930.37 cNexGen 3348B2RF 29.7 49.5 5146 1528 2547 0.5547 847.65 318.42 1166.07 154.37 93.54 918.17 cDeltap<strong>in</strong>e 1219B2RF 29.8 46.6 4864 1450 2266 0.4765 691.09 283.27 974.36 145.93 98.60 729.84 dAssumes:$3.00/cwt g<strong>in</strong>n<strong>in</strong>g cost.$250/ton for seed.Value for l<strong>in</strong>t based on CCC loan value from grab samples <strong>and</strong> FBRI HVI results.