- Page 2 and 3:
Systems Agronomic and EconomicEvalu
- Page 4 and 5:
Scott Russell, EA-IPM, Terry/Yoakum
- Page 6 and 7:
Replicated No-Till LESA Irrigated R
- Page 8 and 9:
Agronomic and Economic Evaluation o
- Page 10:
andomized complete block design was
- Page 14 and 15:
not significant at this location. H
- Page 16 and 17:
Table 1. Inseason plant measurement
- Page 18 and 19:
Table 3. HVI fiber property results
- Page 20 and 21:
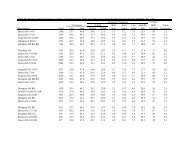
Entry Lint Seed Bur cotton Lint See
- Page 22 and 23:
Table 7. Inseason plant measurement
- Page 24 and 25:
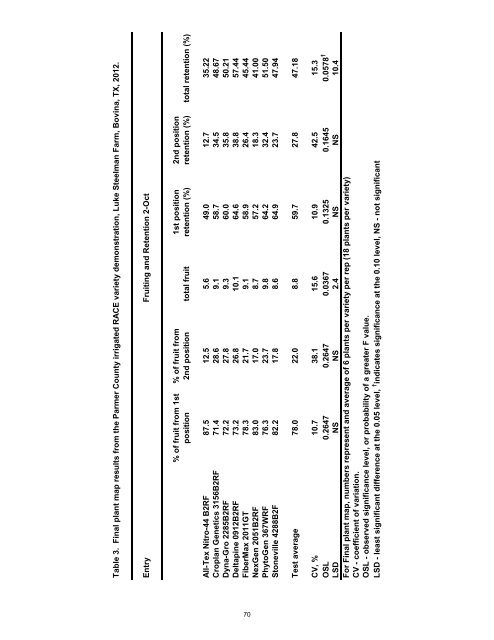
Table 9. Final plant map results fr
- Page 26 and 27: Table 11. HVI fiber property result
- Page 28 and 29: Replicated LESA Irrigated RACE Vari
- Page 30 and 31: Results and Discussion:Agronomic da
- Page 32 and 33: Entry Lint Seed Bur cotton Lint See
- Page 34 and 35: Replicated Sub-Surface Drip Irrigat
- Page 36 and 37: Results and Discussion:Agronomic da
- Page 38 and 39: Entry Lint Seed Bur cotton Lint See
- Page 40 and 41: Replicated LEPA Irrigated RACE Vari
- Page 42 and 43: Results and Discussion:Agronomic da
- Page 44 and 45: Table 2. Final plant map results fr
- Page 46 and 47: Entry Lint Seed Bur cotton Lint See
- Page 48 and 49: Replicated LESA Irrigated RACE Vari
- Page 50 and 51: Results and Discussion:Agronomic da
- Page 52 and 53: Table 2. Final plant map results fr
- Page 54 and 55: Entry Lint Seed Bur cotton Lint See
- Page 56 and 57: Replicated Sub-Surface Drip Irrigat
- Page 58 and 59: Results and Discussion:Agronomic da
- Page 60 and 61: Table 2. Final plant map results fr
- Page 62 and 63: Entry Lint Seed Bur cotton Lint See
- Page 64 and 65: Replicated Sub-Surface Drip Irrigat
- Page 66 and 67: Results and Discussion:Agronomic da
- Page 68 and 69: Table 2. Final plant map results fr
- Page 70 and 71: Entry Lint Seed Bur cotton Lint See
- Page 72 and 73: Replicated LESA Irrigated RACE Vari
- Page 74 and 75: Results and Discussion:Agronomic da
- Page 78 and 79: Entry Lint Seed Bur cotton Lint See
- Page 80 and 81: Replicated No-Till LESA Irrigated R
- Page 82 and 83: Results and Discussion:Acknowledgme
- Page 84 and 85: Table 2. Final plant map results fr
- Page 86 and 87: Entry Lint Seed Bur cotton Lint See
- Page 88 and 89: Replicated LESA Irrigated RACE Vari
- Page 90 and 91: Results and Discussion:Agronomic da
- Page 92 and 93: Table 2. Final plant map results fr
- Page 94 and 95: Entry Lint Seed Bur cotton Lint See
- Page 96 and 97: Replicated LEPA Supplemental (Limit
- Page 98 and 99: lb/acre for FiberMax 2989GLB2. Lint
- Page 100 and 101: Table 2. HVI fiber property results
- Page 102 and 103: Texas Panhandle Cotton Variety Tria
- Page 104 and 105: Biopolymer Research Institue for HV
- Page 106 and 107: Location 2 - DumasAt the Dumas loca
- Page 108 and 109: cotton yields to determine lint and
- Page 110 and 111: Entry Lint Seed Bur cotton Lint See
- Page 112 and 113: Entry Lint Seed Bur cotton Lint See
- Page 114 and 115: Entry Lint Seed Bur cotton Lint See
- Page 116 and 117: Entry Lint Seed Bur cotton Lint See
- Page 118 and 119: Replicated Dryland LargePlot Demons
- Page 120 and 121: Insecticides:Fertilizer management:
- Page 122 and 123: Table 1. Final plant map results fr
- Page 124 and 125: Entry Lint Seed Bur cotton Lint See
- Page 126 and 127:
Replicated Dryland Cotton Variety T
- Page 128 and 129:
Results and Discussion:Significant
- Page 130 and 131:
Table 2. HVI fiber property results
- Page 132 and 133:
125Plains Dryland Systems Variety T
- Page 134 and 135:
127Blanco Dryland Systems Variety T
- Page 136 and 137:
129Dawson County Dryland RACE Demon
- Page 138 and 139:
131Lynn County Irrigated RACE Demon
- Page 140 and 141:
Subsurface Drip Irrigation Pre-plan
- Page 142 and 143:
Effects of Variable In-Season Irrig
- Page 144 and 145:
Table 1. Response of commercially a
- Page 146 and 147:
Table 1. cont. †BrandVarietyVerti
- Page 148 and 149:
There were six locations planted in
- Page 150 and 151:
Table 2. HVI ratings for varieties
- Page 152 and 153:
Table 4. HVI ratings for varieties
- Page 154 and 155:
Table 6. Effect of variety on HVI r
- Page 156 and 157:
Table 7. cont.Variety bRel.ValueRan
- Page 158 and 159:
High Plains (TASS 1N and 1S)Planted
- Page 160 and 161:
Lubbock Air TemperaturesMay, 2012Te
- Page 162 and 163:
Lubbock Air TemperaturesSeptember,
- Page 164 and 165:
Precipitation (inches)4.0LTA20123.0
- Page 166 and 167:
Are side-by-side plots more valuabl
- Page 168:
Is a one-year test valid, or are se