Systems Agronomic and Economic Evaluation of Cotton Varieties in ...
Systems Agronomic and Economic Evaluation of Cotton Varieties in ...
Systems Agronomic and Economic Evaluation of Cotton Varieties in ...

You also want an ePaper? Increase the reach of your titles
YUMPU automatically turns print PDFs into web optimized ePapers that Google loves.
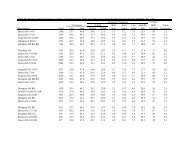
Entry L<strong>in</strong>t Seed Bur cotton L<strong>in</strong>t Seed L<strong>in</strong>t loan L<strong>in</strong>t Seed Total G<strong>in</strong>n<strong>in</strong>g Seed/technologyturnout turnout yield yield yield value value value value cost costTest average 33.8 52.2 3535 1195 1846 0.5710 682.22 230.73 912.95 106.04 69.72CV, % 4.5 1.5 6.5 6.6 6.3 1.2 6.6 6.3 6.5 6.5 --OSL 0.0798 † 0.0038 0.6753 0.5180 0.2476 0.1694 0.4300 0.2477 0.6401 0.6739 --LSD 2.2 1.4 NS NS NS NS NS NS NS NS --For net value/acre, means with<strong>in</strong> a column with the same letter are not significantly different at the 0.05 probability level.CV - coefficient <strong>of</strong> variation.OSL - observed significance level, or probability <strong>of</strong> a greater F value.LSD - least significant difference at the 0.05 level, † <strong>in</strong>dicates significance at the 0.10 level, NS - not significant.Note: some columns may not add up due to round<strong>in</strong>g error.Netvalue737.197.20.6066NSTable 4. Harvest results from the Swisher County irrigated RACE variety demonstration, Cody Gruhlkey Farm, Kress, TX, 2012.-------- % -------- ------------- lb/acre ------------- $/lb ------------------------------------------------- $/acre -------------------------------------------------79Deltap<strong>in</strong>e 0912B2RF 34.4 52.4 3650 1256 1914 0.5678 712.99 239.26 952.26 109.50 73.47 769.28FiberMax 2011GT 36.4 50.6 3385 1234 1714 0.5762 710.75 214.25 925.00 101.54 62.05 761.42Stoneville 4288B2F 34.0 53.6 3602 1224 1932 0.5665 693.20 241.53 934.73 108.05 72.70 753.97PhytoGen 367WRF 33.1 52.4 3663 1211 1919 0.5745 695.55 239.92 935.47 109.89 73.22 752.37Croplan Genetics 3428B2RF 33.3 51.2 3570 1190 1828 0.5785 688.16 228.55 916.70 107.10 69.52 740.08NexGen 3348B2RF 32.3 53.6 3530 1141 1892 0.5685 648.66 236.56 885.22 105.91 64.96 714.35Dyna-Gro 2595B2RF 34.5 51.9 3373 1164 1751 0.5723 666.33 218.91 885.24 101.18 72.78 711.28All-Tex Nitro-44 B2RF 32.5 51.8 3504 1139 1815 0.5637 642.08 226.85 868.94 105.11 69.07 694.76Assumes:$3.00/cwt g<strong>in</strong>n<strong>in</strong>g cost.$300/ton for seed.Value for l<strong>in</strong>t based on CCC loan value from grab samples <strong>and</strong> FBRI HVI results.