Systems Agronomic and Economic Evaluation of Cotton Varieties in ...
Systems Agronomic and Economic Evaluation of Cotton Varieties in ...
Systems Agronomic and Economic Evaluation of Cotton Varieties in ...

Create successful ePaper yourself
Turn your PDF publications into a flip-book with our unique Google optimized e-Paper software.
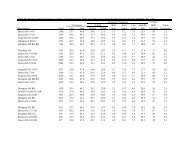
Entry L<strong>in</strong>t Seed Bur cotton L<strong>in</strong>t Seed L<strong>in</strong>t loan L<strong>in</strong>t Seed Total G<strong>in</strong>n<strong>in</strong>g Seed/technologyturnout turnout yield yield yield value value value value cost costCV, % 3.4 2.4 5.6 5.6 5.6 2.6 5.6 5.6 5.6 5.6 --OSL 0.0009 0.0017 0.0968 † 0.3029 0.0128 0.0005 0.0087 0.0127 0.0380 0.098 † --LSD 2.2 2.2 67 NS 42 0.0237 15.38 5.27 20.63 2.02 --For net value/acre, means with<strong>in</strong> a column with the same letter are not significantly different at the 0.05 probability level.CV - coefficient <strong>of</strong> variation.OSL - observed significance level, or probability <strong>of</strong> a greater F value.LSD - least significant difference at the 0.05 level, † <strong>in</strong>dicates significance at the 0.10 level, NS - not significant.Note: some columns may not add up due to round<strong>in</strong>g error.Netvalue7.20.008918.18Table 3. Harvest results from the Floyd County dryl<strong>and</strong> RACE variety demonstration, Gary Nixon Farm, Floydada, TX, 2012.-------- % -------- ------------- lb/acre ------------- $/lb ------------------------------------------------- $/acre -------------------------------------------------117Deltap<strong>in</strong>e 1212B2RF 34.9 52.3 886 309 463 0.5642 174.61 57.88 232.49 26.58 42.64 163.27 aNexGen 4111RF 36.5 52.1 821 300 428 0.5388 161.56 53.48 215.05 24.62 31.67 158.76 abDyna-Gro 2400RF 38.3 52.3 826 316 432 0.5128 162.02 53.94 215.96 24.77 38.71 152.48 abcFiberMax 9170B2F 37.6 49.7 830 312 413 0.5177 161.53 51.59 213.12 24.90 43.62 144.60 bcdAll-Tex Edge B2RF 32.5 52.7 903 294 476 0.5037 147.96 59.44 207.40 27.09 40.76 139.55 cdPhytoGen 499WRF 38.3 48.8 804 308 393 0.5103 157.09 49.07 206.16 24.13 43.93 138.09 cdDeltap<strong>in</strong>e 1044B2RF 36.1 50.4 805 291 406 0.4990 145.20 50.74 195.94 24.16 41.08 130.70 dStoneville 5458B2RF 36.0 54.4 791 285 430 0.5020 142.91 53.77 196.68 23.72 43.62 129.34 dTest average 36.3 51.6 833 302 430 0.5186 156.61 53.74 210.35 25.00 40.76144.60Assumes:$3.00/cwt g<strong>in</strong>n<strong>in</strong>g cost.$250/ton for seed.Value for l<strong>in</strong>t based on CCC loan value from grab samples <strong>and</strong> FBRI HVI results.