Systems Agronomic and Economic Evaluation of Cotton Varieties in ...
Systems Agronomic and Economic Evaluation of Cotton Varieties in ...
Systems Agronomic and Economic Evaluation of Cotton Varieties in ...

Create successful ePaper yourself
Turn your PDF publications into a flip-book with our unique Google optimized e-Paper software.
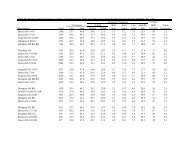
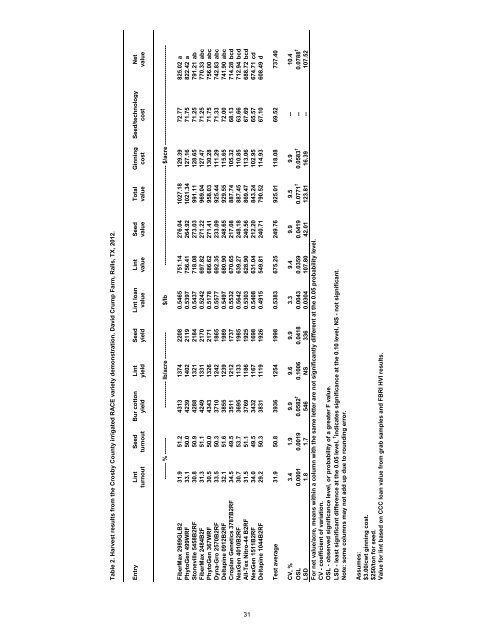
Entry L<strong>in</strong>t Seed Bur cotton L<strong>in</strong>t Seed L<strong>in</strong>t loan L<strong>in</strong>t Seed Total G<strong>in</strong>n<strong>in</strong>g Seed/technologyturnout turnout yield yield yield value value value value cost costTest average 31.9 50.8 3936 1254 1998 0.5383 675.25 249.76 925.01 118.08 69.52CV, % 3.4 1.9 9.9 9.6 9.9 3.3 9.4 9.9 9.5 9.9 --OSL 0.0001 0.0019 0.0582 † 0.1006 0.0418 0.0043 0.0359 0.0419 0.0771 † 0.0583 † --LSD 1.8 1.7 546 NS 336 0.0304 107.80 42.01 123.81 16.39 --For net value/acre, means with<strong>in</strong> a column with the same letter are not significantly different at the 0.05 probability level.CV - coefficient <strong>of</strong> variation.OSL - observed significance level, or probability <strong>of</strong> a greater F value.LSD - least significant difference at the 0.05 level, † <strong>in</strong>dicates significance at the 0.10 level, NS - not significant.Note: some columns may not add up due to round<strong>in</strong>g error.Netvalue737.4010.40.0788 †107.52Table 2. Harvest results from the Crosby County irrigated RACE variety demonstration, David Crump Farm, Ralls, TX, 2012.-------- % -------- ------------- lb/acre ------------- $/lb ------------------------------------------------- $/acre -------------------------------------------------31FiberMax 2989GLB2 31.9 51.2 4313 1374 2208 0.5465 751.14 276.04 1027.18 129.39 72.77 825.02 aPhytoGen 499WRF 33.1 50.0 4239 1402 2119 0.5397 756.41 264.92 1021.34 127.16 71.75 822.42 aStoneville 5458B2RF 30.8 50.9 4288 1321 2184 0.5437 718.08 273.03 991.11 128.65 71.25 791.21 abFiberMax 2484B2F 31.3 51.1 4249 1331 2170 0.5242 697.82 271.22 969.04 127.47 71.25 770.33 abcPhytoGen 367WRF 30.5 50.0 4343 1326 2171 0.5178 686.62 271.41 958.03 130.28 71.75 756.00 abcDyna-Gro 2570B2RF 33.5 50.3 3710 1242 1865 0.5577 692.35 233.09 925.44 111.29 71.33 742.83 abcDeltap<strong>in</strong>e 0912B2RF 32.1 51.6 3855 1239 1989 0.5497 680.90 248.65 929.55 115.65 72.00 741.90 abcCroplan Genetics 3787B2RF 34.5 49.5 3511 1212 1737 0.5532 670.65 217.08 887.74 105.32 68.13 714.28 bcdNexGen 4010B2RF 30.7 53.7 3695 1133 1985 0.5642 639.27 248.18 887.45 110.85 63.66 712.94 bcdAll-Tex Nitro-44 B2RF 31.5 51.1 3769 1186 1925 0.5303 628.90 240.56 869.47 113.06 67.69 688.72 bcdNexGen 1511B2RF 34.0 49.5 3432 1167 1698 0.5408 631.04 212.20 843.24 102.95 65.57 674.71 cdDeltap<strong>in</strong>e 1044B2RF 29.2 50.3 3831 1119 1926 0.4915 549.81 240.71 790.52 114.93 67.10 608.49 dAssumes:$3.00/cwt g<strong>in</strong>n<strong>in</strong>g cost.$250/ton for seed.Value for l<strong>in</strong>t based on CCC loan value from grab samples <strong>and</strong> FBRI HVI results.