Systems Agronomic and Economic Evaluation of Cotton Varieties in ...
Systems Agronomic and Economic Evaluation of Cotton Varieties in ...
Systems Agronomic and Economic Evaluation of Cotton Varieties in ...

You also want an ePaper? Increase the reach of your titles
YUMPU automatically turns print PDFs into web optimized ePapers that Google loves.
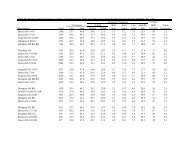
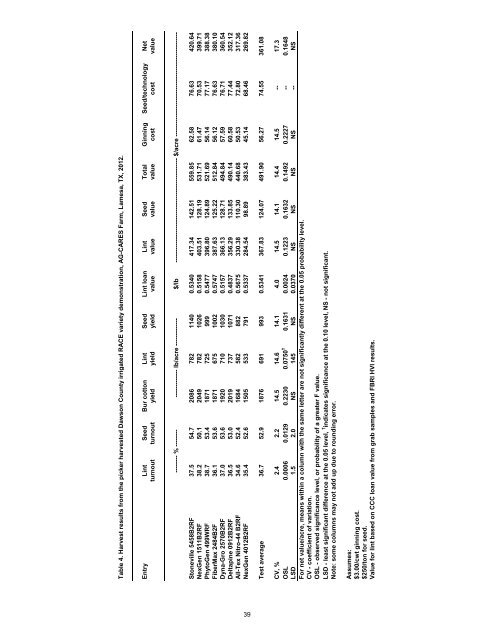
Entry L<strong>in</strong>t Seed Bur cotton L<strong>in</strong>t Seed L<strong>in</strong>t loan L<strong>in</strong>t Seed Total G<strong>in</strong>n<strong>in</strong>g Seed/technology Netturnout turnout yield yield yield value value value value cost cost valueTest average 36.7 52.9 1876 691 993 0.5341 367.83 124.07 491.90 56.27 74.55 361.08CV, % 2.4 2.2 14.5 14.6 14.1 4.0 14.5 14.1 14.4 14.5 -- 17.3OSL 0.0006 0.0129 0.2230 0.0750 † 0.1631 0.0024 0.1223 0.1632 0.1492 0.2227 -- 0.1648LSD 1.5 2.0 NS 145 NS 0.0370 NS NS NS NS -- NSFor net value/acre, means with<strong>in</strong> a column with the same letter are not significantly different at the 0.05 probability level.CV - coefficient <strong>of</strong> variation.OSL - observed significance level, or probability <strong>of</strong> a greater F value.LSD - least significant difference at the 0.05 level, † <strong>in</strong>dicates significance at the 0.10 level, NS - not significant.Note: some columns may not add up due to round<strong>in</strong>g error.Table 4. Harvest results from the picker harvested Dawson County irrigated RACE variety demonstration, AG-CARES Farm, Lamesa, TX, 2012.-------- % -------- ------------- lb/acre ------------- $/lb ------------------------------------------------- $/acre -------------------------------------------------39Stoneville 5458B2RF 37.5 54.7 2086 782 1140 0.5340 417.34 142.51 559.85 62.58 76.63 420.64NexGen 1511B2RF 38.2 50.1 2049 782 1026 0.5158 403.51 128.19 531.71 61.47 70.53 399.71PhytoGen 499WRF 38.7 53.4 1871 725 999 0.5477 396.80 124.89 521.69 56.14 77.17 388.38FiberMax 2484B2F 36.1 53.6 1871 675 1002 0.5747 387.63 125.22 512.84 56.12 76.63 380.10Dyna-Gro 2570B2RF 37.0 53.6 1920 710 1030 0.5157 366.13 128.71 494.84 57.59 76.71 360.54Deltap<strong>in</strong>e 0912B2RF 36.5 53.0 2019 737 1071 0.4837 356.29 133.85 490.14 60.58 77.44 352.12All-Tex Nitro-44 B2RF 34.6 52.4 1684 582 882 0.5675 330.38 110.30 440.68 50.53 72.80 317.36NexGen 4012B2RF 35.4 52.6 1505 533 791 0.5337 284.54 98.89 383.43 45.14 68.46 269.82Assumes:$3.00/cwt g<strong>in</strong>n<strong>in</strong>g cost.$250/ton for seed.Value for l<strong>in</strong>t based on CCC loan value from grab samples <strong>and</strong> FBRI HVI results.