Systems Agronomic and Economic Evaluation of Cotton Varieties in ...
Systems Agronomic and Economic Evaluation of Cotton Varieties in ...
Systems Agronomic and Economic Evaluation of Cotton Varieties in ...

Create successful ePaper yourself
Turn your PDF publications into a flip-book with our unique Google optimized e-Paper software.
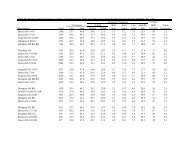
Table 1. Harvest results from the Dryl<strong>and</strong> Production Trial, Cody Walters Farm, Loop, TX, 2012.Entry L<strong>in</strong>t Seed Bur cotton L<strong>in</strong>t Seed L<strong>in</strong>t loan L<strong>in</strong>t Seed Total G<strong>in</strong>n<strong>in</strong>g Seed/technologyturnout turnout yield yield yield value value value value cost costNetvalue-------- % -------- ------------- lb/acre ------------- $/lb ------------------------------------------------- $/acre -------------------------------------------------Deltap<strong>in</strong>e 1044B2RF 23.8 39.9 924 220 369 0.5495 120.78 46.12 166.90 27.73 44.74 94.44 aAll-Tex Epic RF 22.8 38.2 957 218 366 0.5248 114.30 45.69 159.99 28.70 37.21 94.07 aAll-Tex Edge B2RF 21.4 39.2 1011 217 396 0.5492 119.00 49.53 168.53 30.32 44.39 93.82 aPhytoGen 499WRF 22.4 37.0 989 222 366 0.5482 121.75 45.74 167.49 29.68 47.84 89.96 abFiberMax 2989GLB2 21.6 37.5 945 204 354 0.5282 107.61 44.30 151.91 28.35 48.51 75.05 abcStoneville 5458B2RF 20.4 38.7 995 203 385 0.5027 102.12 48.12 150.24 29.85 47.51 72.88 bcDeltap<strong>in</strong>e 1219B2RF 23.1 38.6 845 195 326 0.5143 100.27 40.74 141.01 25.36 44.74 70.91 bcPhytoGen 375WRF 22.0 36.5 834 184 304 0.5353 98.36 37.98 136.34 25.01 47.84 63.50 cTest average 22.2 38.2 937 208 358 0.5315 110.52 44.78 155.30 28.12 45.3581.83CV, % 4.2 5.5 11.1 11.3 11.2 4.8 11.1 11.2 11.1 11.1 --OSL 0.0134 0.5117 0.3471 0.4499 0.1852 0.2832 0.1536 0.1846 0.2266 0.3452 --LSD 1.6 NS NS NS NS NS NS NS NS NS --For net value/acre, means with<strong>in</strong> a column with the same letter are not significantly different at the 0.05 probability level.CV - coefficient <strong>of</strong> variation.OSL - observed significance level, or probability <strong>of</strong> a greater F value.LSD - least significant difference at the 0.05 level, †<strong>in</strong>dicates significance at the 0.10 level, NS - not significant.Note: some columns may not add up due to round<strong>in</strong>g error.17.30.0807†20.30Assumes:$3.00/cwt g<strong>in</strong>n<strong>in</strong>g cost.$250/ton for seed.Value for l<strong>in</strong>t based on CCC loan value from grab samples <strong>and</strong> FBRI HVI results.122