Systems Agronomic and Economic Evaluation of Cotton Varieties in ...
Systems Agronomic and Economic Evaluation of Cotton Varieties in ...
Systems Agronomic and Economic Evaluation of Cotton Varieties in ...

You also want an ePaper? Increase the reach of your titles
YUMPU automatically turns print PDFs into web optimized ePapers that Google loves.
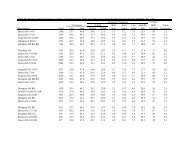
Table 1. Inseason plant measurement results from the Hale County irrigated RACE variety demonstration, Halfway Research Center Farm, Halfway, TX, 2012.30-Jul 8-Aug 15-Augplants/row ft plants/acre rat<strong>in</strong>g (0-9)Test average 3.7 47,698 8.7 6.0 4.0 6.7CV, % 6.9 7.0 4.4 10.0 9.7 --OSL 0.0154 0.0171 0.0182 0.0067 0.0683 † --LSD 0.4 5,736 0.7 1.0 0.6 --For NAWF, numbers represent an average <strong>of</strong> 5 plants per variety per rep (15 plants per variety)For Storm resistance, rat<strong>in</strong>gs based on a scale <strong>of</strong> 0-9 where 9 represents maximum storm resistance.CV - coefficient <strong>of</strong> variation.OSL - observed significance level, or probability <strong>of</strong> a greater F value.LSD - least significant difference at the 0.05 level, † <strong>in</strong>dicates signficance at the 0.10 level.Entry Plant population Nodes Above White Flower (NAWF) for week <strong>of</strong>Storm resistance44All-Tex Nitro-44 B2RF 3.8 49,731 8.4 5.7 3.9 7.0Croplan Genetics 3156B2RF 3.8 49,368 8.3 5.3 3.7 6.0Dyna-Gro 2570B2RF 3.7 48,279 9.1 6.4 4.1 6.0Deltap<strong>in</strong>e 1032B2RF 3.3 43,197 9.2 6.2 4.1 5.0Deltap<strong>in</strong>e 1219B2RF 3.8 49,368 9.3 7.1 4.4 7.0FiberMax 2011GT 3.2 41,745 8.6 5.5 4.1 9.0FiberMax 2484B2F 3.7 47,916 8.4 5.1 4.0 7.0NexGen 4111RF 3.4 44,286 8.5 6.1 3.7 8.0PhytoGen 499WRF 3.9 51,183 8.7 7.1 4.6 7.0Stoneville 4288B2F 4.0 51,909 8.3 5.7 3.5 5.0