Annual Financial Statements 2010 of Bank Austria
Annual Financial Statements 2010 of Bank Austria
Annual Financial Statements 2010 of Bank Austria

You also want an ePaper? Increase the reach of your titles
YUMPU automatically turns print PDFs into web optimized ePapers that Google loves.
Management Report <strong>of</strong> UniCredit <strong>Bank</strong> <strong>Austria</strong> AG<br />
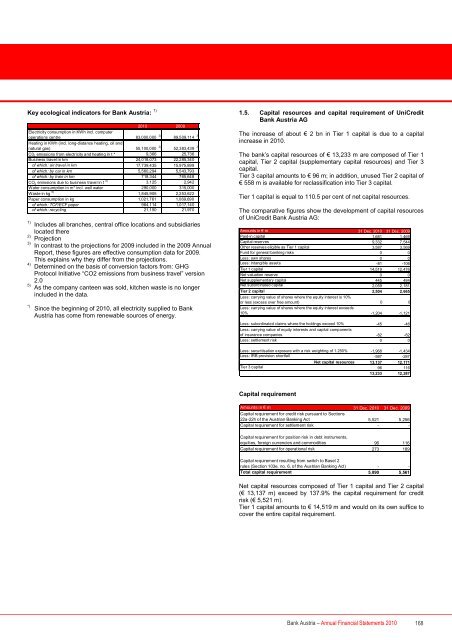
Key ecological indicators for <strong>Bank</strong> <strong>Austria</strong>: 1)<br />
Electricity consumption in KWh incl. computer<br />
operations centre 83,000,000 2)<br />
89,509,114 3)<br />
Heating in KWh (incl. long-distance heating, oil and<br />
natural gas) 55,100,000 2)<br />
52,383,439 3)<br />
C02 emissions from electricity and heating in t * 9,366 25,736<br />
Business travel in km 24,018,073 22,285,340<br />
<strong>of</strong> which: air travel in km 17,739,435 15,975,899<br />
<strong>of</strong> which: by car in km 5,560,294 5,543,793<br />
<strong>of</strong> which: by train in km 718,344 765,648<br />
CO2 emissions due to business travel in t 4)<br />
3,125 2,942<br />
Water consumption in m 3 incl. well water 290,000 315,000<br />
Waste in kg 5)<br />
<strong>2010</strong> 2009<br />
1,845,905 2,253,622<br />
Paper consumption in kg 1,021,761 1,069,690<br />
<strong>of</strong> which: TCF/ECF paper 964,114 1,017,140<br />
<strong>of</strong> which: recycling 21,150 21,970<br />
1)<br />
Includes all branches, central <strong>of</strong>fice locations and subsidiaries<br />
located there<br />
2)<br />
Projection<br />
3)<br />
In contrast to the projections for 2009 included in the 2009 <strong>Annual</strong><br />
Report, these figures are effective consumption data for 2009.<br />
This explains why they differ from the projections.<br />
4)<br />
Determined on the basis <strong>of</strong> conversion factors from: GHG<br />
Protocol Initiative “CO2 emissions from business travel” version<br />
2.0<br />
5)<br />
As the company canteen was sold, kitchen waste is no longer<br />
included in the data.<br />
*) Since the beginning <strong>of</strong> <strong>2010</strong>, all electricity supplied to <strong>Bank</strong><br />
<strong>Austria</strong> has come from renewable sources <strong>of</strong> energy.<br />
1.5. Capital resources and capital requirement <strong>of</strong> UniCredit<br />
<strong>Bank</strong> <strong>Austria</strong> AG<br />
The increase <strong>of</strong> about € 2 bn in Tier 1 capital is due to a capital<br />
increase in <strong>2010</strong>.<br />
The bank’s capital resources <strong>of</strong> € 13,233 m are composed <strong>of</strong> Tier 1<br />
capital, Tier 2 capital (supplementary capital resources) and Tier 3<br />
capital.<br />
Tier 3 capital amounts to € 96 m; in addition, unused Tier 2 capital <strong>of</strong><br />
€ 558 m is available for reclassification into Tier 3 capital.<br />
Tier 1 capital is equal to 110.5 per cent <strong>of</strong> net capital resources.<br />
The comparative figures show the development <strong>of</strong> capital resources<br />
<strong>of</strong> UniCredit <strong>Bank</strong> <strong>Austria</strong> AG:<br />
Amounts in € m 31 Dec. <strong>2010</strong> 31 Dec. 2009<br />
Paid-in capital 1,681 1,469<br />
Capital reserves 9,332 7,544<br />
Other reserves eligible as Tier 1 capital 3,587 3,569<br />
Fund for general banking risks 0 0<br />
Less: own shares 0 0<br />
Less: intangible assets -81 -106<br />
Tier 1 capital 14,519 12,476<br />
Net valuation reserve 0 0<br />
Net supplementary capital 445 484<br />
Net subordinated capital 2,059 2,181<br />
Tier 2 capital 2,504 2,665<br />
Less: carrying value <strong>of</strong> shares where the equity interest is 10%<br />
or less (excess over free amount) 0 0<br />
Less: carrying value <strong>of</strong> shares where the equity interest exceeds<br />
10% -1,204 -1,121<br />
Less: subordinated claims where the holdings exceed 10% -45 -46<br />
Less: carrying value <strong>of</strong> equity interests and capital components<br />
<strong>of</strong> insurance companies -82 -82<br />
Less: settlement risk 0 0<br />
Less: securitisation exposure with a risk weighting <strong>of</strong> 1.250% -1,968 -1,434<br />
Less: IRB provision shortfall -587 -287<br />
Net capital resources 13,137 12,171<br />
Tier 3 capital 96 116<br />
13,233 12,287<br />
Capital requirement<br />
Amounts in € m 31 Dec. <strong>2010</strong> 31 Dec. 2009<br />
Capital requirement for credit risk pursuant to Sections<br />
22a-22h <strong>of</strong> the <strong>Austria</strong>n <strong>Bank</strong>ing Act 5,521 5,256<br />
Capital requirement for settlement risk - -<br />
Capital requirement for position risk in debt instruments,<br />
equities, foreign currencies and commodities 96 116<br />
Capital requirement for operational risk 273 189<br />
Capital requirement resulting from switch to Basel 2<br />
rules (Section 103e, no. 6, <strong>of</strong> the <strong>Austria</strong>n <strong>Bank</strong>ing Act) - -<br />
Total capital requirement 5,890 5,561<br />
Net capital resources composed <strong>of</strong> Tier 1 capital and Tier 2 capital<br />
(€ 13,137 m) exceed by 137.9% the capital requirement for credit<br />
risk (€ 5,521 m).<br />
Tier 1 capital amounts to € 14,519 m and would on its own suffice to<br />
cover the entire capital requirement.<br />
<strong>Bank</strong> <strong>Austria</strong> – <strong>Annual</strong> <strong>Financial</strong> <strong>Statements</strong> <strong>2010</strong> 168