Annual Financial Statements 2010 of Bank Austria
Annual Financial Statements 2010 of Bank Austria
Annual Financial Statements 2010 of Bank Austria

Create successful ePaper yourself
Turn your PDF publications into a flip-book with our unique Google optimized e-Paper software.
Management Report<br />
Management Report (CONTINUED)<br />
<strong>Financial</strong> and non-financial performance indicators<br />
Volume and pr<strong>of</strong>itability<br />
� Average loans and receivables with customers (net <strong>of</strong> loan loss<br />
provisions, stated at € 127.5 m in the statement <strong>of</strong> financial position),<br />
were only slightly above the level <strong>of</strong> 2009 (+0.3%) despite a<br />
vigorous upturn from quarter to quarter (Q4 <strong>2010</strong>/Q4 2009 +4.1%).<br />
The development in <strong>Austria</strong> and CEE reflects the U-shaped trend<br />
already referred to in this report. In <strong>Austria</strong>, lending volume almost<br />
matched the previous year’s figure in a comparison <strong>of</strong> Q4 <strong>2010</strong> with<br />
Q4 2009 (–0.9%), but the average figure for <strong>2010</strong> as a whole was<br />
still 2.8% lower than in 2009. In CEE (supported by the appreciation<br />
<strong>of</strong> CEE currencies in recent months), lending volume expanded from<br />
quarter to quarter (Q4 <strong>2010</strong>/Q4 2009 +9.6%) to exceed the previous<br />
year’s level in annual average terms (+3.4%). The bank’s<br />
unweighted lending volume is <strong>of</strong> more or less equal significance in<br />
both <strong>of</strong> its key regions, <strong>Austria</strong> and CEE.<br />
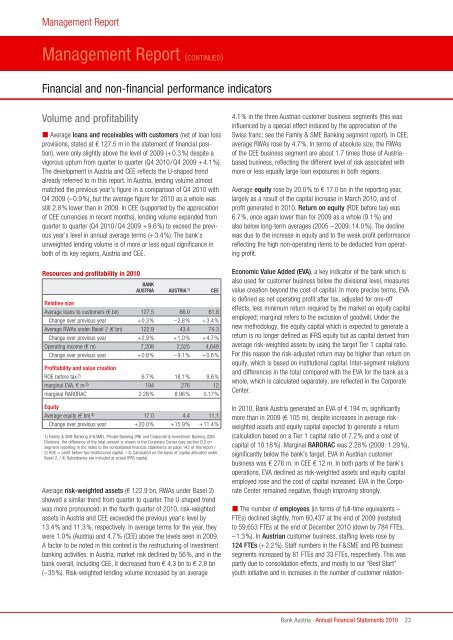
Resources and pr<strong>of</strong>itability in <strong>2010</strong><br />
BANk<br />
AUStrIA AUStrIA 1) CEE<br />
relative size<br />
Average loans to customers (€ bn) 127.5 66.0 61.8<br />
Change over previous year +0.3% –2.8% +3.4%<br />
Average RWAs under Basel 2 (€ bn) 122.9 43.4 74.3<br />
Change over previous year +2.9% +1.0% +4.7%<br />
Operating income (€ m) 7,208 2,525 4,649<br />
Change over previous year +0.8% – 9.1% +0.6%<br />
Pr<strong>of</strong>itability and value creation<br />
ROE before tax 2) 6.7% 18.1% 9.6%<br />
marginal EVA, € m 3) 194 276 12<br />
marginal RARORAC 2.28% 8.96% 0.17%<br />
Equity<br />
Average equity (€ bn) 4) 17.0 4.4 11.1<br />
Change over previous year +20.0% +15.9% +11.4%<br />
1) Family & SME <strong>Bank</strong>ing (F&SME), Private <strong>Bank</strong>ing (PB) and Corporate & Investment <strong>Bank</strong>ing (CIB)<br />
Divisions; the difference <strong>of</strong> the total amount is shown in the Corporate Center (see section D.2 on<br />
segment reporting in the notes to the consolidated financial statements on page 142 <strong>of</strong> this report /<br />
2) ROE = pr<strong>of</strong>it before tax/institutional capital. / 3) Calculated on the basis <strong>of</strong> capital allocated under<br />
Basel 2. / 4) Subsidiaries are included at actual IFRS capital.<br />
Average risk-weighted assets (€ 122.9 bn, RWAs under Basel 2)<br />
showed a similar trend from quarter to quarter. The U-shaped trend<br />
was more pronounced: in the fourth quarter <strong>of</strong> <strong>2010</strong>, risk-weighted<br />
assets in <strong>Austria</strong> and CEE exceeded the previous year’s level by<br />
13.4% and 11.3%, respectively. In average terms for the year, they<br />
were 1.0% (<strong>Austria</strong>) and 4.7% (CEE) above the levels seen in 2009.<br />
A factor to be noted in this context is the restructuring <strong>of</strong> investment<br />
banking activities: in <strong>Austria</strong>, market risk declined by 56%, and in the<br />
bank overall, including CEE, it decreased from € 4.3 bn to € 2.8 bn<br />
(–35%). Risk-weighted lending volume increased by an average<br />
4.1% in the three <strong>Austria</strong>n customer business segments (this was<br />
influenced by a special effect induced by the appreciation <strong>of</strong> the<br />
Swiss franc; see the Family & SME <strong>Bank</strong>ing segment report). In CEE,<br />
average RWAs rose by 4.7%. In terms <strong>of</strong> absolute size, the RWAs<br />
<strong>of</strong> the CEE business segment are about 1.7 times those <strong>of</strong> <strong>Austria</strong>based<br />
business, reflecting the different level <strong>of</strong> risk associated with<br />
more or less equally large loan exposures in both regions.<br />
Average equity rose by 20.0% to € 17.0 bn in the reporting year,<br />
largely as a result <strong>of</strong> the capital increase in March <strong>2010</strong>, and <strong>of</strong><br />
pr<strong>of</strong>it generated in <strong>2010</strong>. return on equity (ROE before tax) was<br />
6.7%, once again lower than for 2009 as a whole (9.1%) and<br />
also below long-term averages (2005 –2009: 14.0%). The decline<br />
was due to the increase in equity and to the weak pr<strong>of</strong>it performance<br />
reflecting the high non-operating items to be deducted from operating<br />
pr<strong>of</strong>it.<br />
Economic Value Added (EVA), a key indicator <strong>of</strong> the bank which is<br />
also used for customer business below the divisional level, measures<br />
value creation beyond the cost <strong>of</strong> capital. In more precise terms, EVA<br />
is defined as net operating pr<strong>of</strong>it after tax, adjusted for one-<strong>of</strong>f<br />
effects, less minimum return required by the market on equity capital<br />
employed; marginal refers to the exclusion <strong>of</strong> goodwill. Under the<br />
new methodology, the equity capital which is expected to generate a<br />
return is no longer defined as IFRS equity but as capital derived from<br />
average risk-weighted assets by using the target Tier 1 capital ratio.<br />
For this reason the risk-adjusted return may be higher than return on<br />
equity, which is based on institutional capital. Inter-segment relations<br />
and differences in the total compared with the EVA for the bank as a<br />
whole, which is calculated separately, are reflected in the Corporate<br />
Center.<br />
In <strong>2010</strong>, <strong>Bank</strong> <strong>Austria</strong> generated an EVA <strong>of</strong> € 194 m, significantly<br />
more than in 2009 (€ 105 m), despite increases in average riskweighted<br />
assets and equity capital expected to generate a return<br />
(calculation based on a Tier 1 capital ratio <strong>of</strong> 7.2% and a cost <strong>of</strong><br />
capital <strong>of</strong> 10.18%). Marginal rArOrAC was 2.28% (2009: 1.29%),<br />
significantly below the bank’s target. EVA in <strong>Austria</strong>n customer<br />
business was € 276 m, in CEE € 12 m. In both parts <strong>of</strong> the bank’s<br />
operations, EVA declined as risk-weighted assets and equity capital<br />
employed rose and the cost <strong>of</strong> capital increased. EVA in the Corporate<br />
Center remained negative, though improving strongly.<br />
� The number <strong>of</strong> employees (in terms <strong>of</strong> full-time equivalents –<br />
FTEs) declined slightly, from 60,437 at the end <strong>of</strong> 2009 (restated)<br />
to 59,653 FTEs at the end <strong>of</strong> December <strong>2010</strong> (down by 784 FTEs,<br />
–1.3%). In <strong>Austria</strong>n customer business, staffing levels rose by<br />
124 FtEs (+2.2%). Staff numbers in the F&SME and PB business<br />
segments increased by 81 FTEs and 33 FTEs, respectively. This was<br />
partly due to consolidation effects, and mostly to our “Best Start”<br />
youth initiative and in increases in the number <strong>of</strong> customer relation-<br />
<strong>Bank</strong> <strong>Austria</strong> · <strong>Annual</strong> <strong>Financial</strong> <strong>Statements</strong> <strong>2010</strong><br />
23